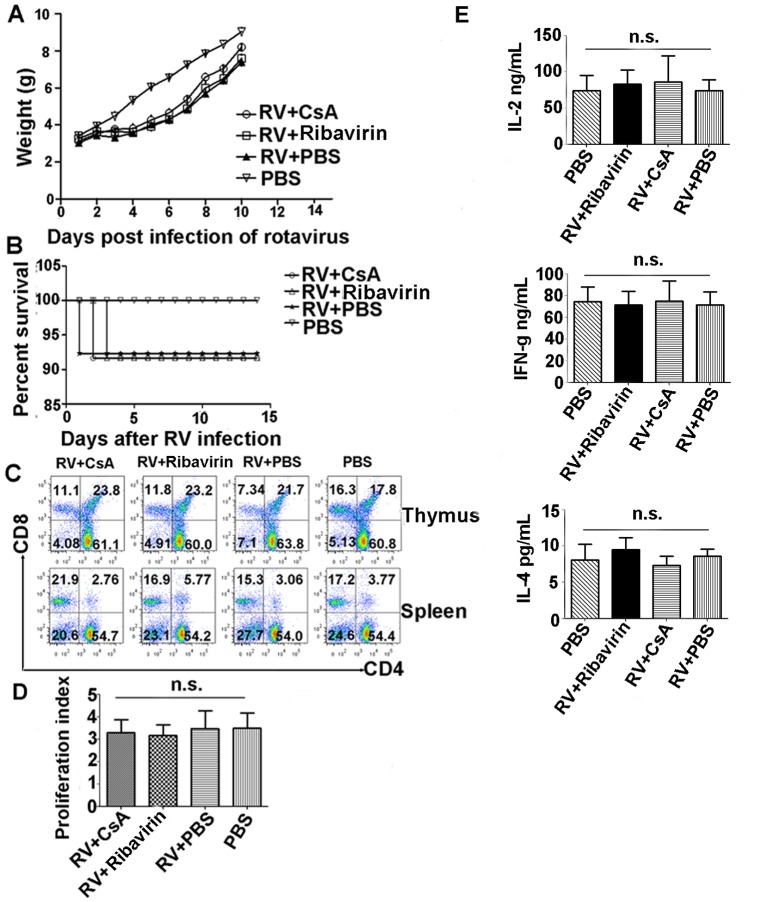
Figure 7. CsA toxicity analysis in the animal model.
Body weight growth curve (A) and survival curve (B) after CsA treatment of RV-infected BALB/c mice. Body weight or survival were monitored among the 4 groups of mice during the week following rotavirus infection challenge CsA or PBS treatment (mean ± SEM, n >10). (C) CD4/CD8 T-cell ratio analysis in spleens and thymus from RV-infected mice treated with CsA or Ribavirin. (D) Proliferation assay of splenocytes in RV infected and CsA treatment mice by CFSE labeling. Ribavirin treatment mice as positive control and PBS treatment mice as negative control. Proliferation index (PI) was 3.47±0.37, 3.16±0.47, 3.47±0.79, 3.49±0.67 respectively. (E) IL-2, IL-4, and IFN-γ analysis from cell culture supernatants by sandwich ELISA. Data are representative of at least 3 independent experiments (n = 10 mice/group). Error bars indicate the SD with technical triplicates. N.s., not significant (*P<0.05, **P<0.01).

