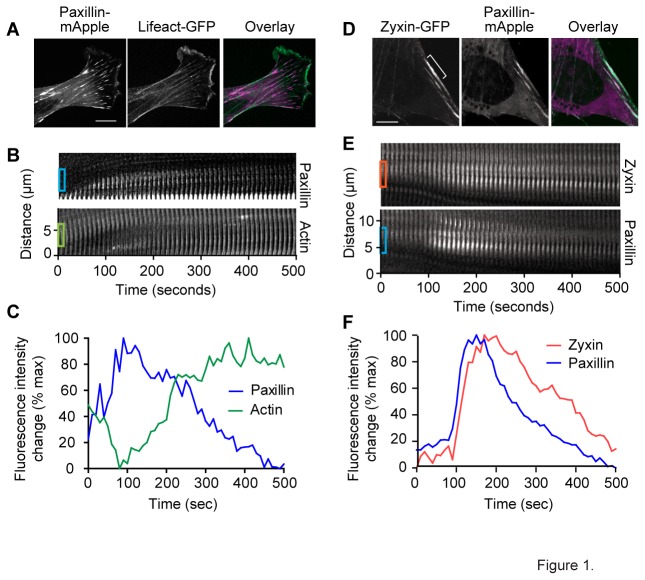
Figure 1. Stress fiber strain sites recruit paxillin.
(A) The localization of paxillin is not restricted to focal adhesions. Time lapse micrographs taken at 10 second intervals of live mouse fibroblasts expressing paxillin-mApple and Lifeact-GFP (A and B) or zyxin-GFP and paxillin-mApple (D and E). Kymograph (B) and average intensity plotted over time (C) of boxed regions from kymograph (B) showing recruitment of paxillin and concurrent thinning actin. (D) Still frames showing overlap of paxillin and zyxin at a strain site. Kymographs (E) showing progression of zyxin and paxillin recruitment in the white bracketed region of (D) over time. Intensity plot (F) of the boxed regions on the kymograph. Scale bar=10um.

