
Figure 2. Profile of provirus integration in transduced cells.
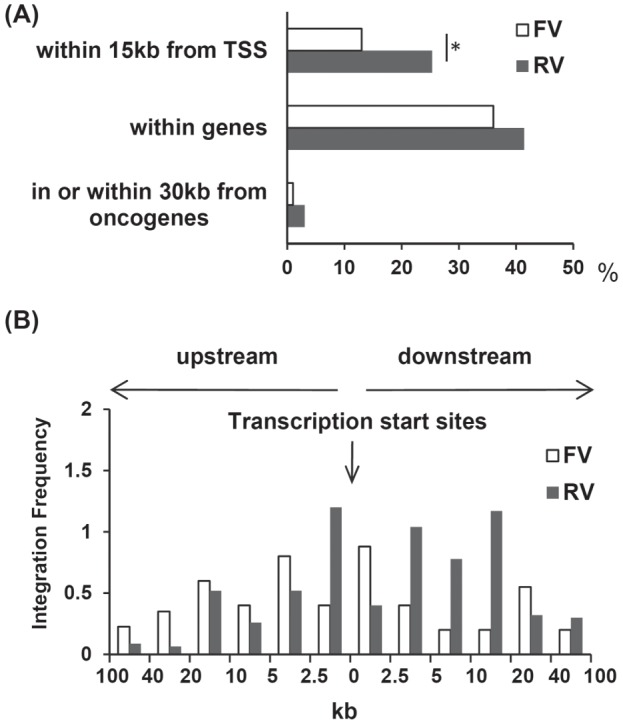
(A) Position of FV and RV integration sites. The percentage of all integration sites within 15 kb of transcriptional start sites, within genes that contain putative microRNA genes, and within 30 kb of oncogenes is shown for FV vector- or RV vector-treated cells. *p<0.05, χ2-test. (B) A 100-kb window centered on TSS in the RefSeq database is shown. Relative frequencies of FV and RV vector integrations in each interval were calculated by dividing the percentage of integration b the indicated interval length.