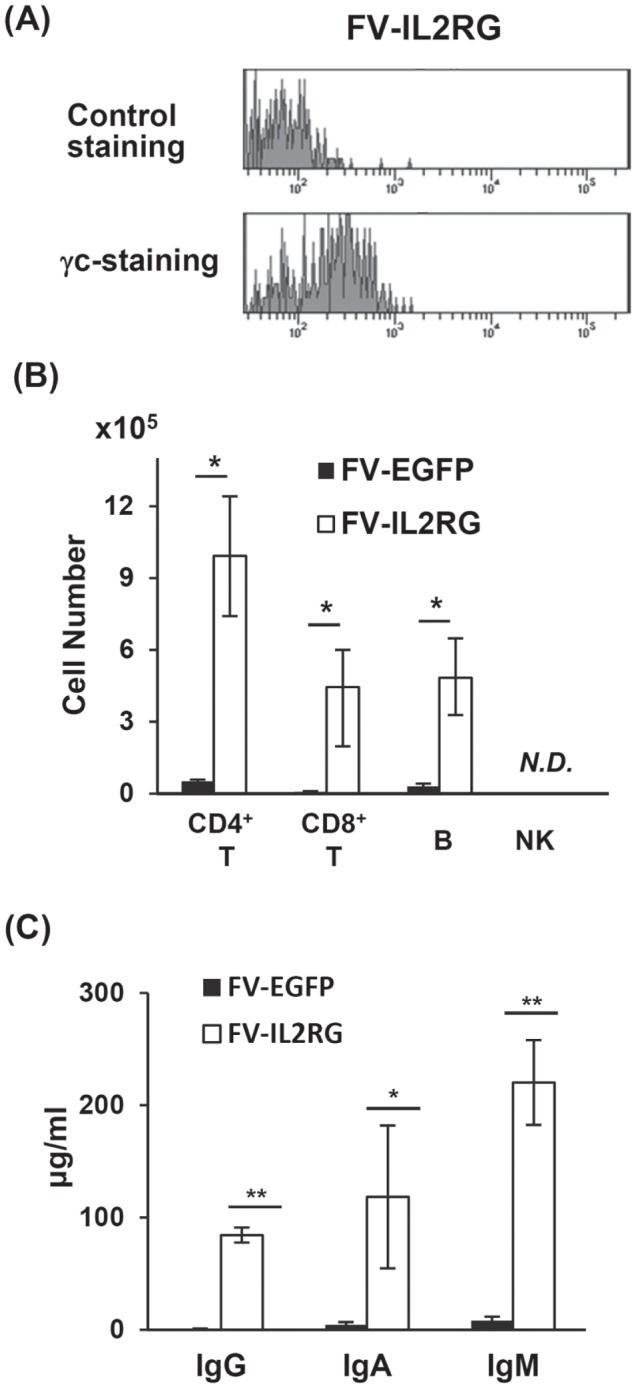
Figure 3. Reconstitution of T and B cells.

(A) Cell-surface expression of γc on peripheral CD8+ T cells in γc-KO mice treated with FV-IL2RG-treated HSCs. The upper and lower panels show isotype-control and γc-specific stainings, respectively. (B) The absolute numbers of CD4+ T, CD8+ T, sIgM+ B, and NK cells in the spleen of γc-KO mice treated with FV-EGFP and FV-IL2RG (n = 4 in each group). N.D., not detectable. (C) Serum IgM, IgG, and IgA in FV-IL2RG-treated mice. Serum levels of IgM, IgG, and IgA were measured by ELISA. Results shown are the mean ± SD of the stimulation index from 4 mice in each group. *p<0.05 and **p<0.01, Student t-test.
