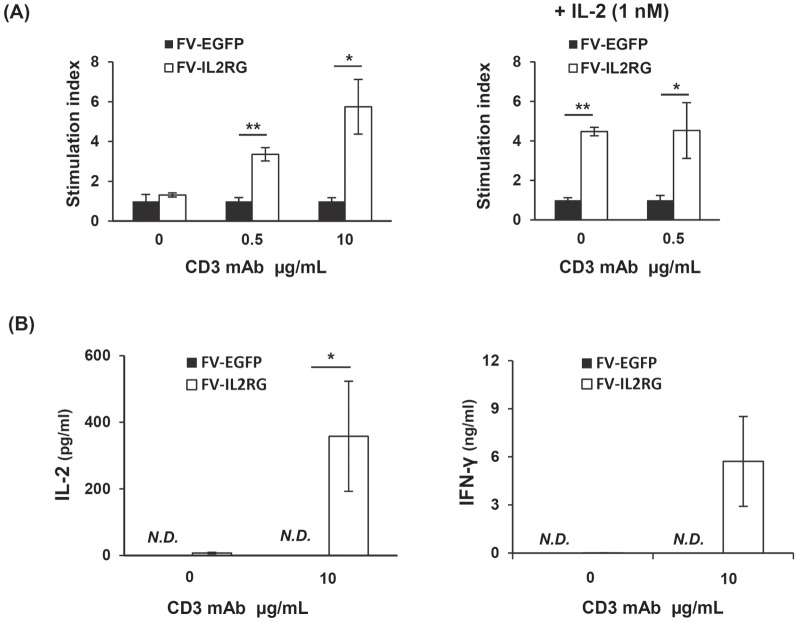
Figure 4. In vitro function of reconstituted T cells.
(A) Splenocytes from recipient mice were stimulated with an anti-CD3 mAb at the indicated dose in the presence (right) or absence (left) of IL-2. Results shown are the mean ± SD of the stimulation index from 4 or 5 mice in each group. *p<0.05 and **p<0.01, Student t-test. (B) IL-2 and IFN-γ production by reconstituted T cells. Splenocytes from recipient mice were stimulated with an anti-CD3 mAb at the indicated dose. Culture supernatants were collected 24 and 72 hours after stimulation. Concentration of each cytokine in the supernatant was measured by ELISA. Results shown are the mean ± SD from 4 mice in each group. *p<0.05, Student t-test. N.D., not detectable.

