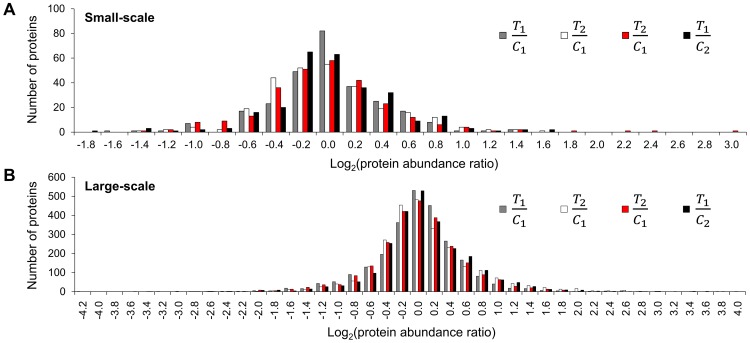
Figure 5. The distribution of four sets of treatment to control log2 protein abundance ratios.
(A) Small-scale experiment. (B) Large-scale experiment. T 1/C 1, T 2/C 2, T 2/C 1 and T 1/C 2 were the protein abundance ratios of sample T1 to C1, sample T2 to C2, sample T2 to C1 and sample T1 to C2, respectively.

