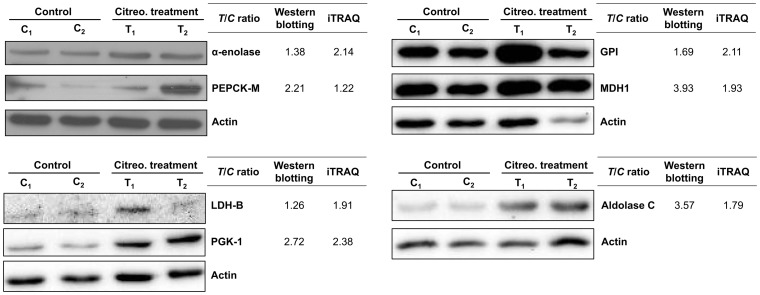
Figure 8. Citreoviridin induced the up-regulation of proteins catalyzing glucose metabolism.
Protein expressions of seven proteins involved in glucose metabolism, α-enolase, PEPCK-M, GPI, MDH1, LDH-B, PGK-1 and aldolase C, were measured by western blotting. Actin was used as an internal loading control. The expression levels of two control tumors (C1 and C2) and two citreoviridin-treated tumors (T1 and T2) from a total of four different mice were quantified. The band intensities were normalized to actin, and the averages of intensities from two control samples and two treatment samples were calculated, respectively. Fold change of protein expression shown was obtained by dividing the intensity of control group by the intensity of treatment group. The T/C (treatment to control) ratios from the iTRAQ large-scale experiment were listed for comparison.

