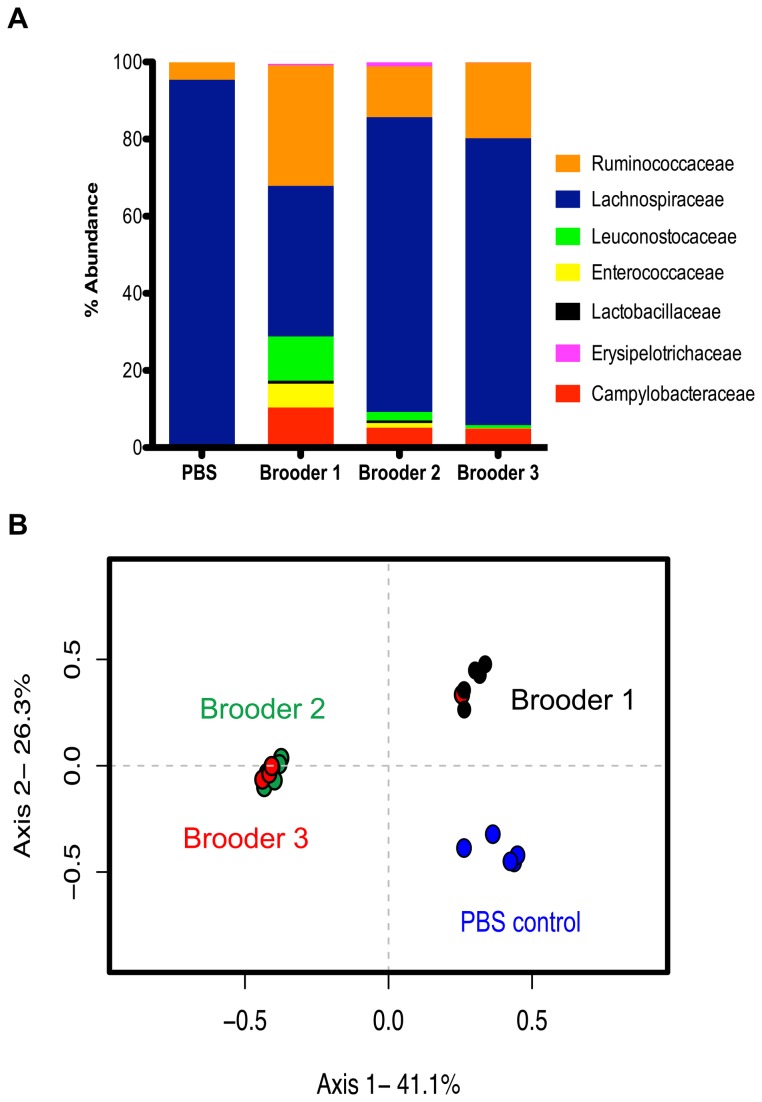
Figure 2. The cecal microbiota of chickens colonized with C. jejuni.
A. Defining members of the cecal microbiota by relative rank abundance plots (>1%) at the bacterial family level. The average relative abundance for each treatment group (PBS control n=5; brooder 1 n=5; brooder 2 n=5; brooder 3 n=5) is represented in the bar plot. B. Principle coordinates analysis (PCoA) illustrating the community structure relationship between chicks from different treatment groups. This ordination was generated using a Yue and Clayton-based distance matrix representing the relative abundance of OTUs in each community at a 3% OTU definition level. The community of each chick is indicated by a colored symbol (PBS control = blue; brooder 1 = black; brooder 2 = green; brooder 3 = red). All brooder bacterial communities were significantly different from PBS controls (p=0.008 for brooder1 and p=0.007 for brooder 2 and 3; AMOVA). Brooder 1 was significantly different from Brooder 2 and 3 (p=0.003 and p=0.015, respectively; AMOVA).

