
Figure 2.
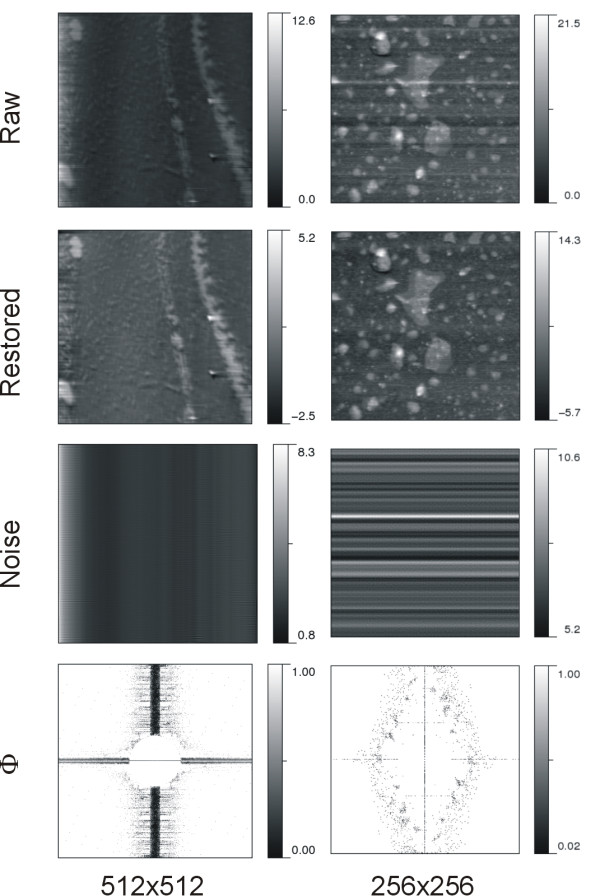
AFM imaging on biomembranes. Numbers at the bottom of the figure are the number of pixels composing the image. On the left column, the image area and the intensity unit are 10.0 × 10.0 μm2 and 1.0 nm, respectively. On the right column, the image area is 2.0 × 2.0 μm2 and the intensity is in the unit of 1.0 nm. Note that the varying shading degree in the calibration bar is used for inspecting intensity variations in the image that are bounded by the extreme values indicated.