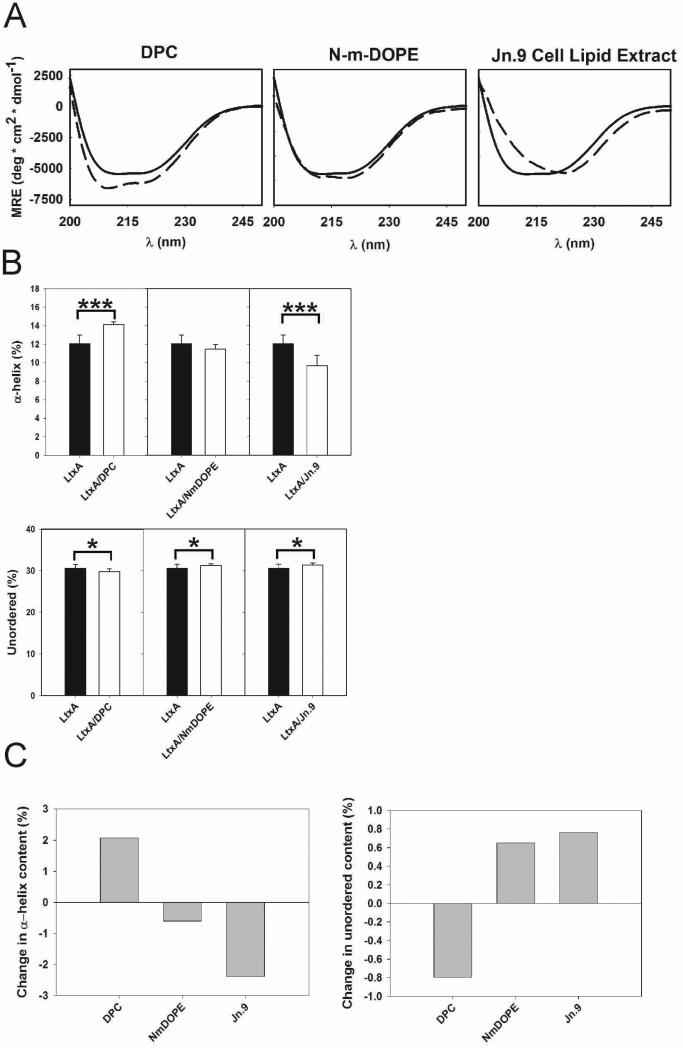
Fig. 3.
Lipid-dependent structural changes in LtxA. (A) CD spectra of LtxA in solution (solid lines) and LtxA incubated with DPC, N-m-DOPE, and Jn.9 cell extracted lipids (dashed lines), at protein:lipid molar ratios of 2×10⁻⁴. The plotted curves are the averages of identical repeated samples (n = 3, as described in the Experimental section). (B) Deconvoluted CD spectra from (A) including α-helices and unordered content. (C) Changes in α-helical and unordered content. (*** p < 0.001, * p < 0.05).

