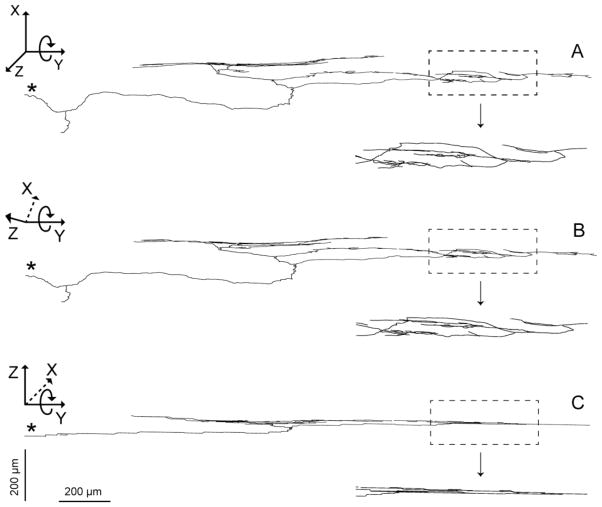
Figure 2.
A tracing of an IMA from the LES in the digital coordinate space of the Neurolucida software. The morphometry software renders afferent arbors as 3D stick figures with multiple features quantified (for photomicrographic 2D renderings of IMAs, see Figs. 3 and 4). Panel A: A parent neurite (designated with an asterisk) enters at 9:00 o’clock, travels to the middle of the panel, and then bifurcates repeatedly to form the IMA arbor. The window on right shows at a higher power the pattern of branching in the arbor. The dimensions of the full IMA arbor can be gauged using the scale bars at the bottom of Panel C. Panels B and C illustrate that, in the software coordinate space, arbors can be rotated and measured from any perspective. In the examples illustrated, the Z-axis of the IMA is rolled 45° around the Y-axis (in panel B) and then another 45° around the Y-axis (in panel C) to examine the planar arbor in side view or at 90° to the perspective in Panel A. The scale bars apply to main section of each of the three panels: the horizontal scale applies to the Y-dimension, and the vertical scale applies to both the X- and Z-dimensions.

