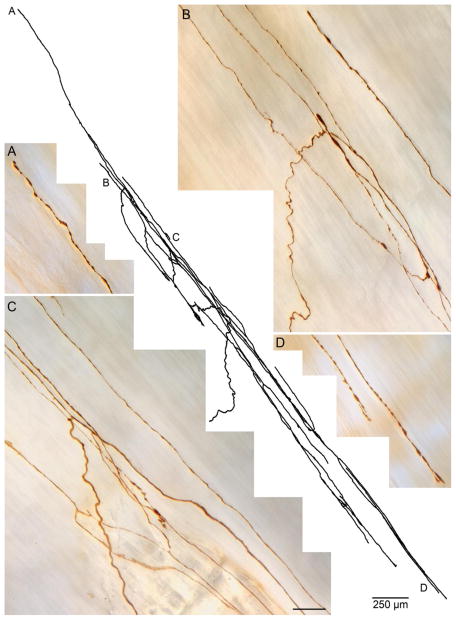
Figure 3.
A representative dextran-biotin labeled clasp muscle IMA. In the center, a Photoshop tracing of the IMA terminal arbor illustrates an incoming parent fiber (at about 8:00 o’clock) that bifurcates and branches repeatedly to produce a typical array of long terminal processes that run in and parallel to clasp muscle fibers (not stained). Panels A through D are high-power all-in-focus photomicrographs of neurites from the traced IMA taken at the locations in the tracing designated by the corresponding letters. The tracing scale bar = 250 μm; the scale bar in Panel C = 20 μm for all four photomicrographs.

