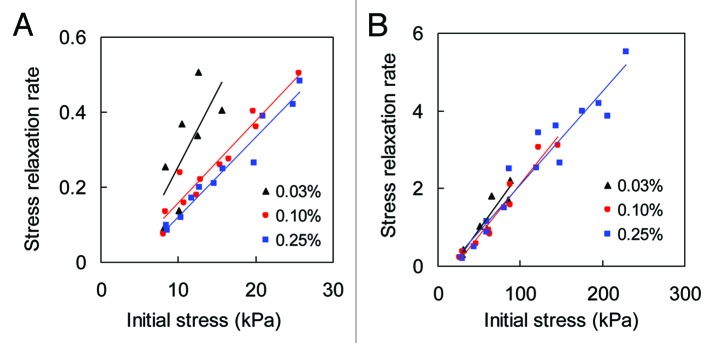
Figure 3. The rate of stress relaxation vs. initial stress levels for (A) collagen gel, and (B) collagen thin film crosslinked with 0.03%, 0.1%, and 0.25% GP. Solid lines are linear fit to aid viewing.

Figure 3. The rate of stress relaxation vs. initial stress levels for (A) collagen gel, and (B) collagen thin film crosslinked with 0.03%, 0.1%, and 0.25% GP. Solid lines are linear fit to aid viewing.