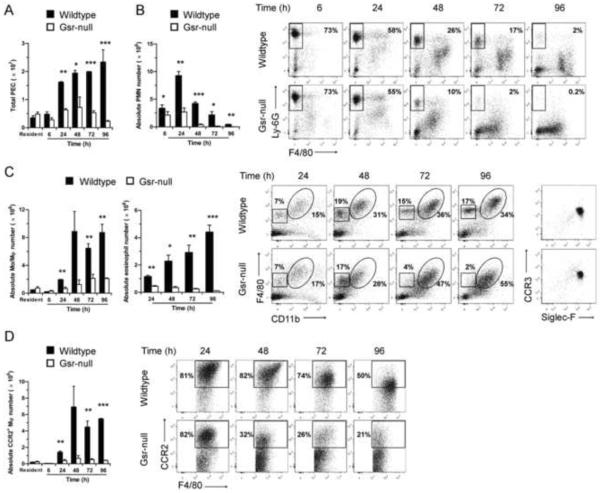
Figure 5.
Abnormal leukocyte mobilization in Gsr-deficient mice after thioglycollate stimulation. Resident and thioglycollate-elicited peritoneal cells were harvested from the peritoneal cavity of wildtype and Gsr-deficient mice either prior to or after thioglycollate stimulation at various time-points. Numbers of total leukocytes in peritoneal lavage fluid were counted using a hemocytometer. The peritoneal lavage cells were sedimented by centrifugation, stained with leukocyte markers, and analyzed by flow cytometry. Peritoneal lavage cells were first gated on forward scatter (FSC) and side scatter (SSC) to exclude cell debris, and viable cells were then gated for CD11b+Ly-6GhighF4/80− neutrophils, and CD11b+F4/80high monocytes/macrophages. The CD11b−F4/80low cells outlined in the squares of were further gated for CCR3 and Siglec-F expression (right column). Since the CD11b−F4/80low cells were positive for Siglec-F and CCR3, these cells are considered to be eosinophils. A. Time-dependent changes in the numbers of total peritoneal elicited leukocyte cells (PEC). B. Time-dependent changes in the numbers (bar graph on the left) and flow cytometry plots (on the right) of peritoneal neutrophils. Dots in the rectangle regions within the scatter plots are neutrophils (CD11b+Ly-6GhighF4/80−), and numbers given on the right side of the rectangles indicate the percentage of neutrophils among the total PEC. C. Time-dependent changes in the numbers (bar graph on the left) and flow cytometry plots (on the right) of peritoneal monocytes/macrophages and eosinophils. Dots in the ovals and squares within the scatter plots are macrophages/monocytes (CD11b+F4/80high) and eosinophils (CD11b−F4/80lowSiglec-F+CCR3+), respectively. The percentages of the monocytes/macrophages (on the right side of the ovals) and the eosinophils (above the squares) among the total PEC are indicated in the plots. Cells in the squares were further gated and plotted for CCR3 and Siglec-F expression (right columns). Since the CD11b−F4/80low cells were positive for Siglec-F and CCR3, these cells are considered as eosinophils. D. Time-dependent changes in the numbers (bar graph on the left) and flow cytometry plots (on the right) of inflammatory monocytes/macrophages. The CD11b+F4/80high monocytes/macrophages outlined in the ovals of cytometry plots in panel B were further gated for CCR2 expression to identify inflammatory monocytes/macrophages (CD11b+F4/80highCCR2+). The numbers given in the scatter plots in D indicate the percentage of inflammatory monocytes/macrophages within the monocyte/macrophage population. Absolute numbers of each leukocyte subset were calculated according to the total PEC numbers and the percentages of each leukocyte groups determined by flow cytometry. Values in the graphs represent mean ± SEM of at least 3 independent experiments. *, p < 0.05; **, p < 0.01; ***, p < 0.001 (Student's t-test), compared between wildtype and Gsr-deficient groups at the same time-points. The scatter plots shown are results from representative experiments.

