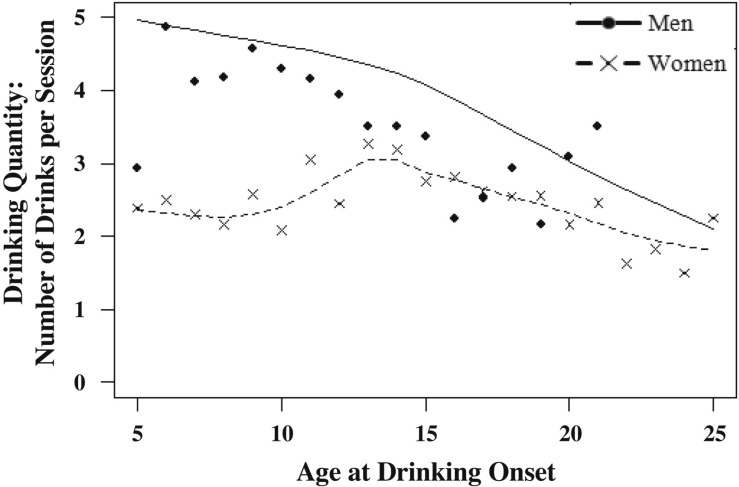
Figure 2.
Smoothing spline plot representing drinking quantity (number of drinks per drinking session) in adulthood as a function of age at onset of drinking for men and women. Line represents predicted data points as indicated by the smoothing spline parameter. Data points (dots and crosses) represent observed data points for men and women.

