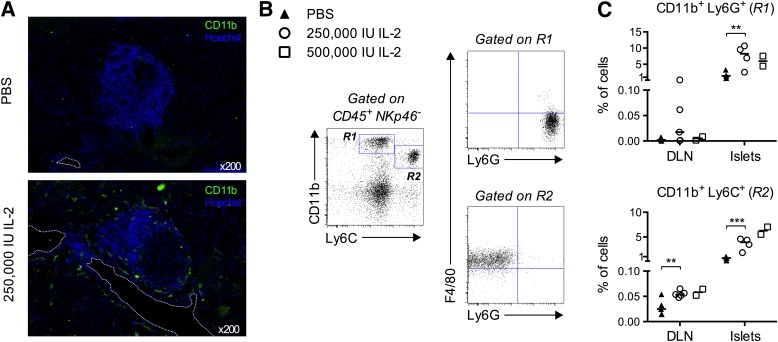
FIG. 3.
Administration of high doses of IL-2 to NOD mice: effects on myeloid cells. Mice were treated as in Figure 2. A: Representative immunofluorescence of cryosections from the pancreas of mice treated with PBS (top) or 250,000 IU IL-2 (bottom), stained with anti-CD11b Abs (green) and Hoechst (blue) (magnification ×200). Dashed line indicates blood vessels. B: Myeloid cell-gating strategy: islet-infiltrating cells were pregated as CD45+ NKp46−, and expression of CD11b versus Ly6C was used to define gates R1 and R2 as shown. Cells in these gates were further analyzed for the expression of F4/80 and Ly6G. Cells in gate R1 were mostly F4/80− and Ly6G+, probably representing neutrophils, and cells in gate R2 were mostly F4/80+ and Ly6G−, probably representing tissue macrophages. C: Percentages of cells in gate R1 (top) and R2 (bottom) in islets, DLN, LNs, and spleen of mice in indicated treatment groups. Data are cumulative of two independent experiments with two to five mice per condition, except for A, which is from one experiment with three mice per group. Symbols represent individual mice and horizontal lines represent the median. **P < 0.01; ***P < 0.001 (unpaired, two-tailed Student t test).

