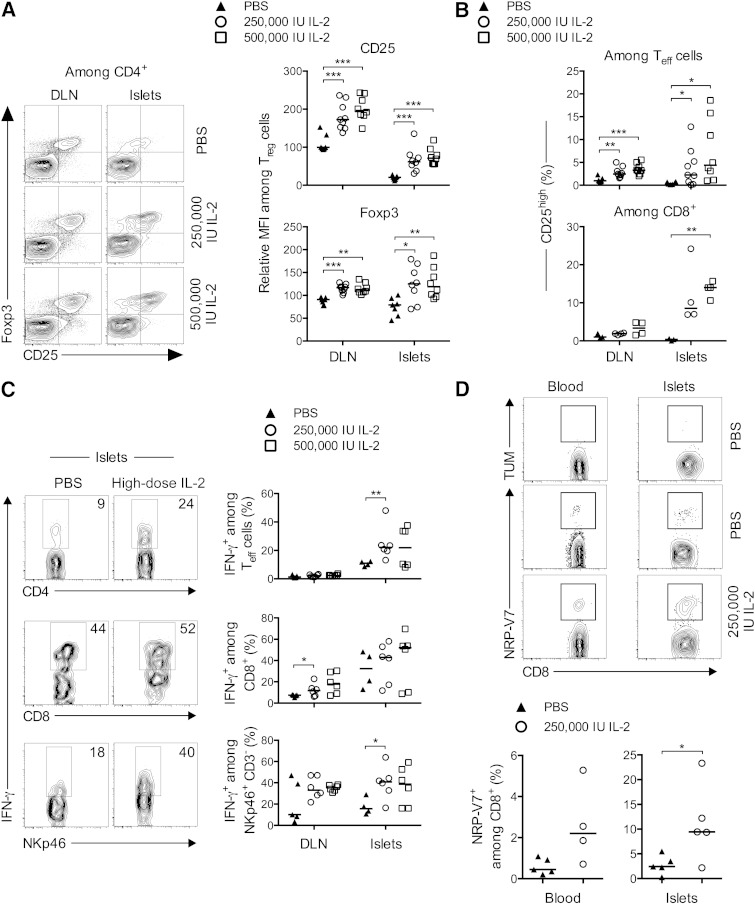
FIG. 4.
Administration of high doses of IL-2 to NOD mice: effects on cell activation and cytokine production. Mice were treated as in Figure 2, and DLN and pancreas-infiltrating cells were analyzed by flow cytometry. A, left: Representative contour plots of Foxp3 and CD25 expression in CD4+ T cells in indicated groups. Right: Relative mean fluorescence intensity (MFI) of Foxp3 and CD25 in Treg cells expressed as the relative percentage of the MFI value in nondraining LNs of PBS-treated mice, which was assigned an arbitrary value of 100%. B: Percentages of CD25+ cells among CD4+ Foxp3− (Teff cells) (top) and CD8+ T cells (bottom). C: Representative contour plots of IFN-γ staining (left) and the percentage of IFN-γ–secreting cells (right) among islet-infiltrating CD4+ Foxp3− (top), CD8+ (middle), and NK cells (bottom) quantified after ex vivo stimulation with PMA-ionomycin. Data are cumulative of two to three independent experiments with four to nine mice per group. *P < 0.05; **P < 0.01; ***P < 0.001 (unpaired, two-tailed Student t test). D, top: Representative histograms of control TUM and NRP-V7 tretramer expression on CD8+ T cells from blood and islets. Bottom: Percentage of NRP-V7+ CD8+ T cells among total CD8+ T cells in blood (left) and in the pancreatic islets (right). Data are from one experiment, symbols represent individual mice, and horizontal lines represent the median. *P < 0.05 (unpaired, two-tailed Mann-Whitney test).

