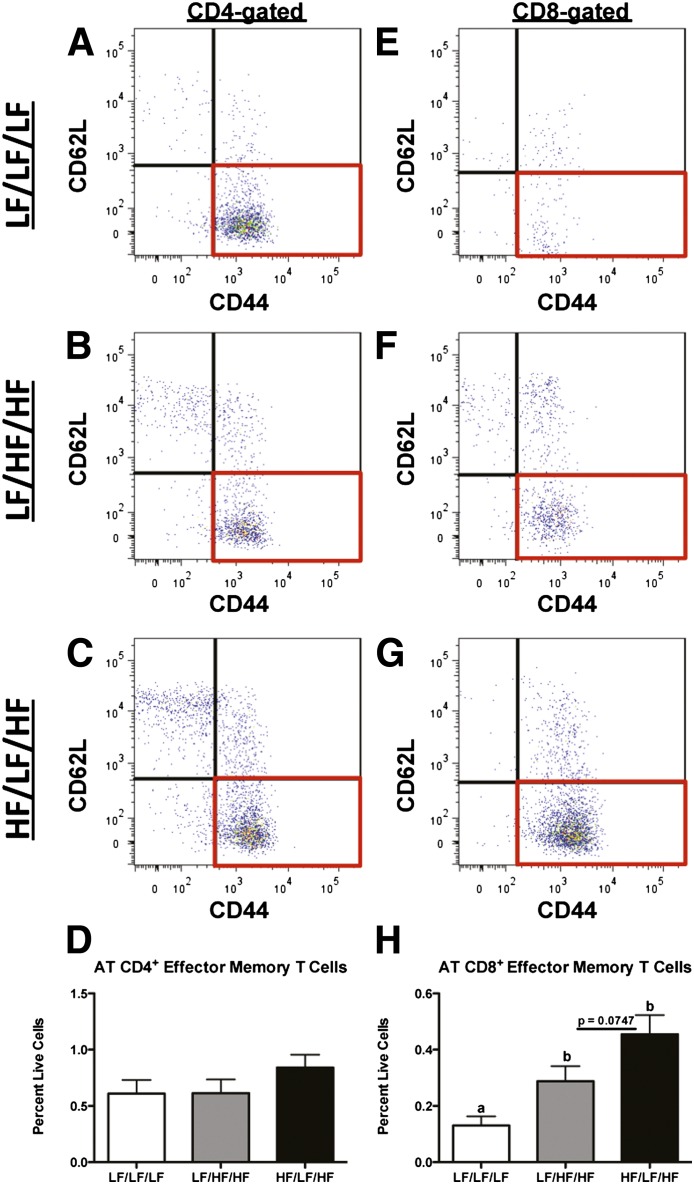
FIG. 7.
Increased CD8+, but not CD4+, effector memory T-cell accumulation in AT during obesity. SVF cells were isolated from the epididymal AT and analyzed by flow cytometry. A and E: LF/LF/LF (lean control) group. B and F: LF/HF/HF (weight gain) group. C and G: HF/LF/HF (weight cycling) group. Cells were gated for the lymphocyte population based upon forward and side scatter (Supplementary Fig. 1), selected for expression of either CD4 (A–D) or CD8 (E–H) (Fig. 5) and then analyzed for memory T-cell markers. Representative flow cytometry dot plots of CD4+ cells analyzed for CD62L and CD44 (A–C). D: Quantification of CD4+ effector memory T cells (CD62L−CD44+) by flow cytometry. Representative flow cytometry dot plots of CD8+ cells analyzed for CD62L and CD44 (E–G). H: Quantification of CD8+ effector memory T cells (CD62L−CD44+) by flow cytometry. Data are presented as mean ± SEM; n = 6–12/group. Groups not connected by the same letter are significantly different; P < 0.05. HF/LF/HF, weight-cycling group; LF/HF/HF, weight-gain group; LF/LF/LF, lean control group.

