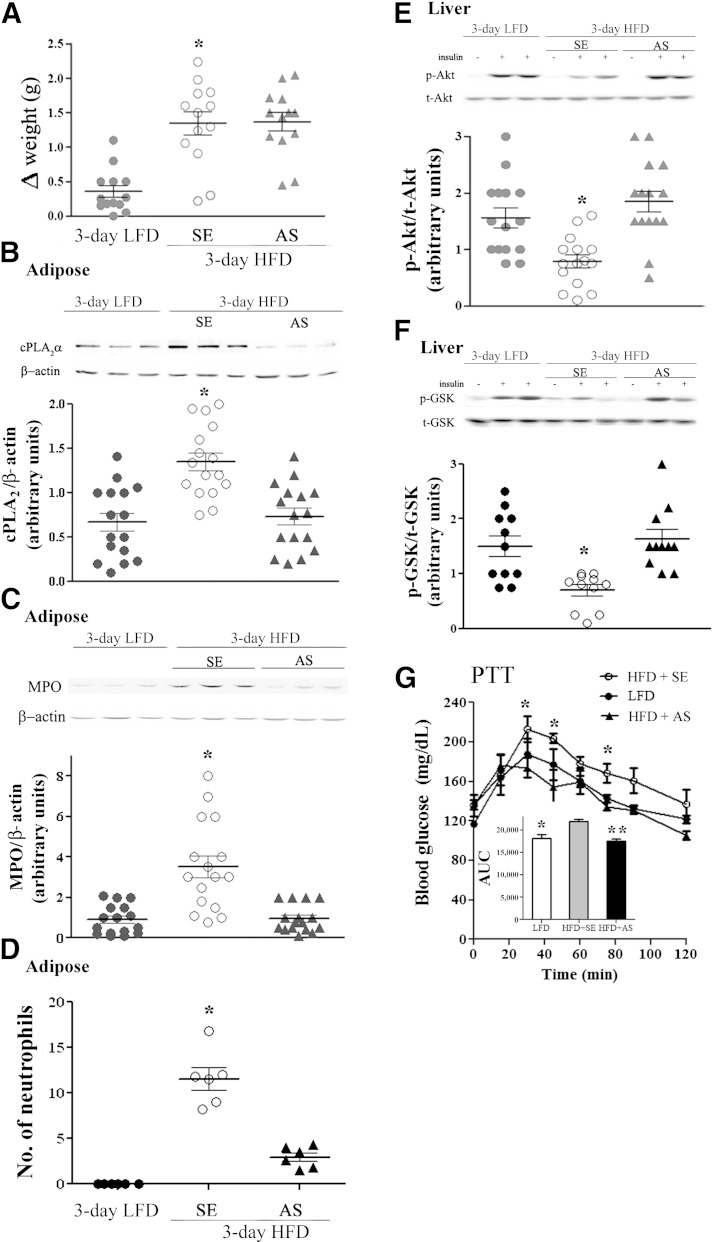
FIG. 2.
Inhibition of neutrophil recruitment to epididymal adipose tissue by cPLA2α-specific AS oligonucleotide prevents hepatic insulin resistance. Mice were intravenously injected 1 day before the initiation of the HFD and every day during the diet with 2 mg/kg AS against cPLA2α. The HFD control mice were administrated with 100 μL saline or 2 mg/kg sense (SE) oligonucleotide, and because there was no difference between the two groups, they were combined (SE). Control LFD mice were fed a normal diet for 3 days. Half of the control LFD mice were administrated 100 μL saline, which did not cause any effect compared with the noninjected mice. The weight and the densitometry of the immunoblot of the individual mice in each group performed in three independent experiments are presented. A: *P < 0.001 between the two groups of mice on the HFD and the LFD mice at day 3 of the diet. B: A representative immunoblot of cPLA2α and the corresponding β-actin protein expression in epididymal adipose tissue lysates of the different groups of mice. The intensity of each cPLA2α band was divided by the intensity of the respective β-actin band after quantitation by densitometry and expressed as arbitrary units. *P < 0.001 for control HFD mice (SE) compared with HFD mice with AS treatment or LFD mice. C: A representative immunoblot and densitometry analyses of MPO (a specific neutrophil marker) and β-actin in epididymal fat from LFD mice, AS-treated HFD mice, and control mice (SE). The intensity of each MPO band was divided by the intensity of the respective β-actin band after quantitation by densitometry and expressed as arbitrary units. *P < 0.001 in control HFD mice (SE) compared with AS-treated HFD mice or LFD mice. D: The presence of stained neutrophils using mouse anti-neutrophils antibody (NIMP-R14) in sections of epididymal adipose tissues. Results are the mean ± SEM number per field, derived from 20 individual fields for each mouse from two independent experiments. *P < 0.001 in control HFD mice (SE) compared with AS-treated HFD mice or LFD mice. E and F: For each group of mice, liver lysate of a mouse that was not treated with insulin (–) and lysates from two different mice treated with insulin (+) are presented. Densitometry analysis for p-Akt and p-GSK were performed as in Fig. 1A. *P < 0.001, significant decrease of control HFD mice (SE) compared with HFD mice with AS treatment or LFD mice. G: Pyruvate tolerance test (PTT) in 3-day HFD mice after overnight fast. The results are the mean ± SEM of six mice in each group performed in two independent experiments. The inset describes the area under the curve (AUC). *P < 0.05, **P < 0.01 compared with SE-treated HFD mice (SE) by two-way ANOVA and Bonferroni post-test analysis. t, total.

