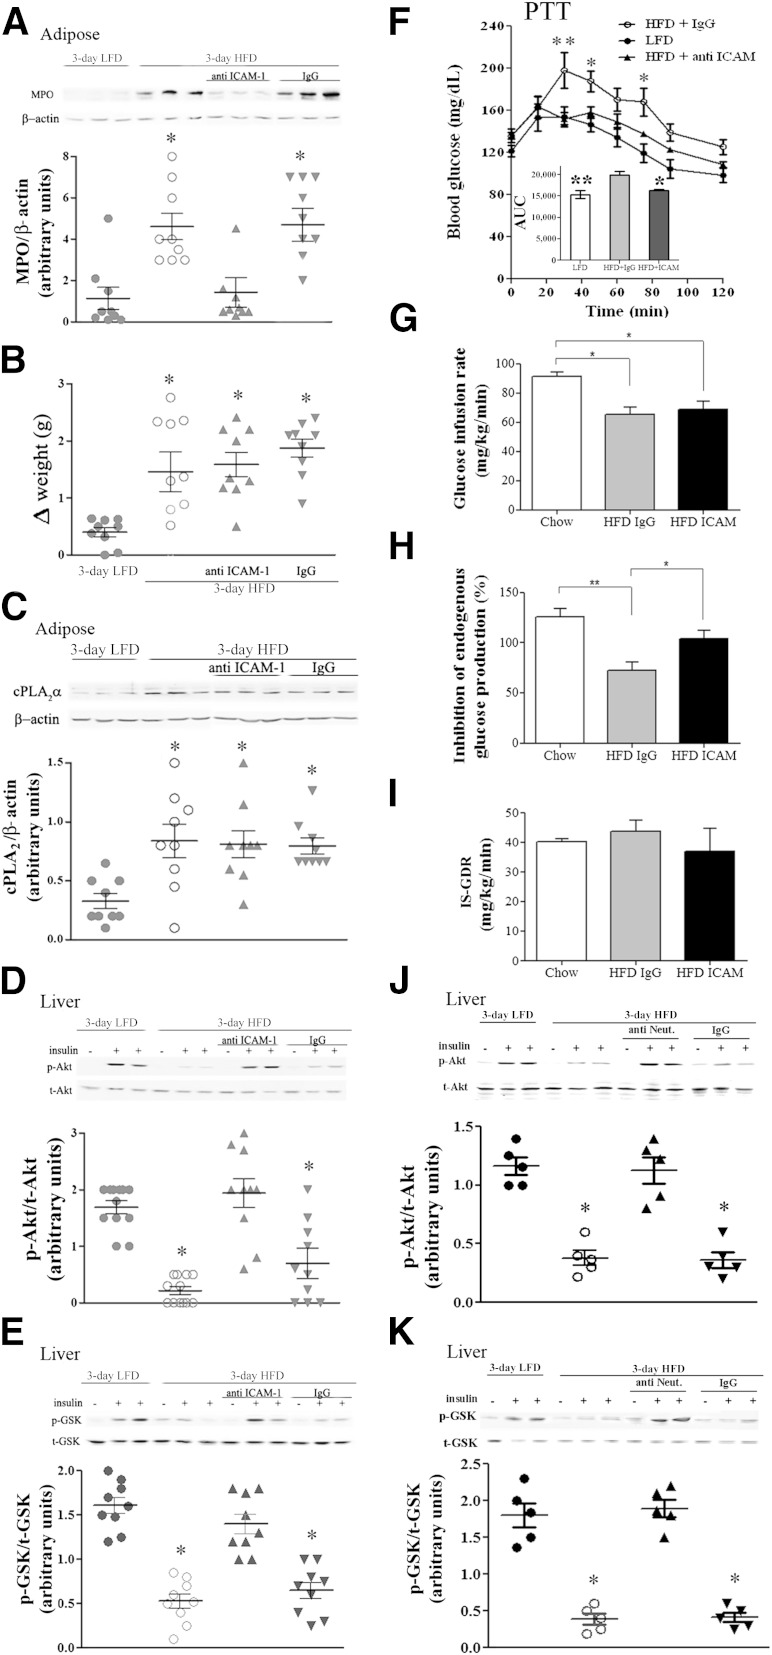
FIG. 4.
Prevention of neutrophil recruitment to epididymal adipose tissue by anti–ICAM-1 antibodies prevented hepatic insulin resistance in response to 3-day HFD. Mice were intraperitoneally injected (100 μg/kg) with anti–ICAM-1 antibodies 2 days before the initiation of the HFD and every other day thereafter. The HFD control mice were administrated 100 μL saline or rat IgG2b, isotype control. The weight and the densitometry of the immunoblot of the individual mice in each group performed in three different experiments are presented. A: A representative immunoblot of MPO in epididymal fat. Densitometry analysis for MPO was performed as described in Fig. 2C. *P < 0.001, significant increase of control HFD mice (open circles) and anti-IgG–treated HFD mice (down gray triangles) compared with HFD mice treated with anti–ICAM-1 antibodies (up gray triangles) and LFD mice (filled circles). B: Effect of treatment on body weight. *P < 0.001 between the groups of mice fed the HFD and the group fed the LFD at day 3 of the diet. C: A representative immunoblot analysis of cPLA2α and the corresponding β-actin protein expression in adipose tissue lysates of the different groups of mice. Densitometry analysis for cPLA2α was performed as in Fig. 2B. There is a significant difference (*P < 0.001) among the groups of mice fed the HFD compared with the LFD at day 3 of the diet. D and E: Representative immunoblots and densitometry analyses of p-Akt (serine 473) and p-GSK (serine 9). For each group of mice, liver lysate of a mouse that was not treated with insulin (–) and lysates from two different mice treated with insulin (+) are presented. Densitometry analyses for p-Akt and p-GSK were performed as in Fig. 1A. *P < 0.001, significant decrease of control HFD mice and anti-IgG–treated HFD mice compared with HFD mice treated with anti–ICAM-1 antibodies and LFD mice. F: Pyruvate tolerance test (PTT) after an overnight fast. The inset describes the area under the curve (AUC). The results are the mean ± SEM of six mice in each group performed in two independent experiments. **P < 0.01, *P < 0.05 compared with ICAM-1 antibody-treated HFD mice by two-way ANOVA and Bonferroni post-test analysis. Hyperinsulinemic-euglycemic clamp studies with glucose infusion rate (GIR) (G), insulin-inhibited endogenous glucose production (EGP) (H), and insulin-stimulated glucose disposal rate (IS-GDR) (I) were conducted in chow-fed (open), IgG-treated HFD-fed (gray), and ICAM-treated HFD-fed (black) mice. (Further clamp results are in Supplementary Fig. 1.) Results are the means of four (chow-fed) or four (HFD-fed) animals. All error bars represent SEM. *P < 0.05, **P < 0.01 ANOVA, followed by Newman-Keuls post hoc test. J and K: Neutrophil depletion prevented insulin resistance in the 3-day HFD liver. Representative immunoblots and densitometry analyses are shown for p-Akt (serine 473) and p-GSK (serine 9). For each group of mice, liver lysate of a mouse that was not treated with insulin (–) and lysates from two different mice treated with insulin (+) are presented. Densitometry analyses for p-Akt and p-GSK were performed as in Fig. 1A. *P < 0.001, significant decrease of control HFD mice compared with neutrophil-depleted HFD mice and LFD mice. t, total.

