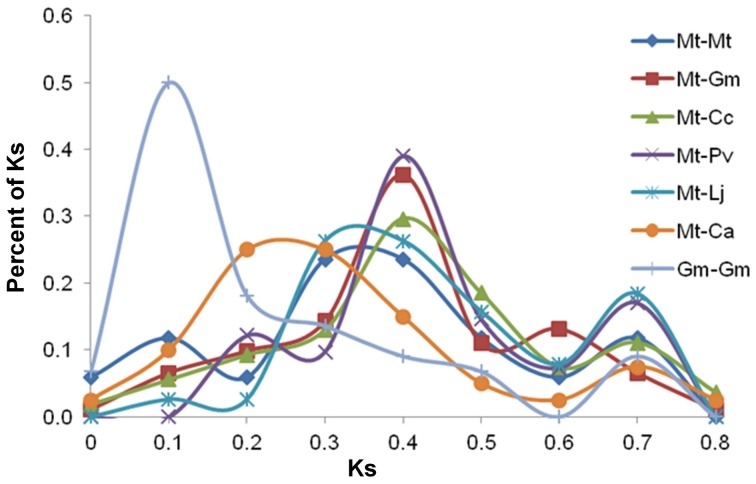
Figure 3.
Ks proportional plot based on sequence data for 20 NF-related genes. This plot shows peaks based on Ks values between Mt and other five legume species and one peak based on Ks values of inparalogs of Gm (Gm-Gm). The plots shows three types of peaks: (i) the first type of peak observed at Ks 0.1 indicates recent genome duplication in Gm, (ii) the second type of peaks observed at or near Ks 0.4 indicate speciation, and (iii) the third type of peaks observed at Ks 0.6 or Ks 0.7 correspond to ancient genome duplication.

