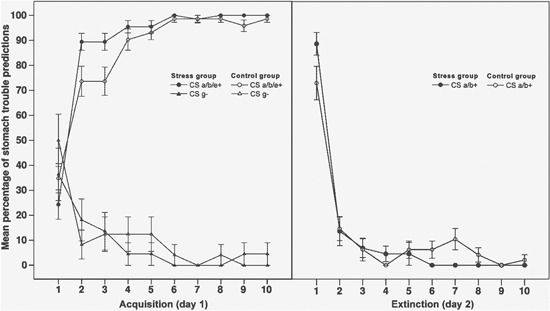
Figure 1.

Mean percentage of stomach trouble predictions to critical stimuli across all trials of the acquisition phase (left side of the graph) and the extinction phase (right side). For the acquisition phase, data is averaged over stimuli (CS) a, b and e as they underlay similar contingencies in this phase. CS e+ and g− were not shown during extinction. CS a/b+ were shown in context A during acquisition (day 1) and extinguished in context B (day 2). Error bars indicate standard errors of the mean.
