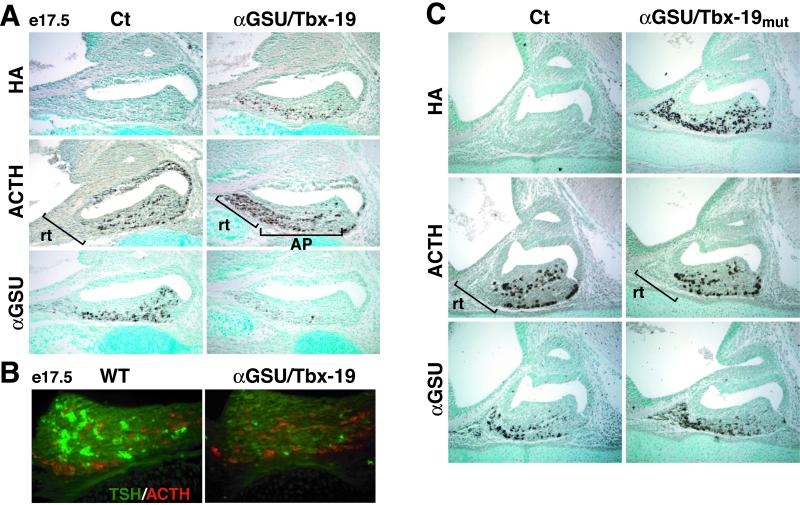
Figure 4.
Phenotype of the αGSU/Tbx19 mouse pituitary gland. (A) The expression of HA-tagged Tbx19 follows the normal pattern of αGSU-expression, but levels of αGSU are markedly decreased, whereas ACTH is now expressed in virtually all rostral tip cells, no change in expression of ventral anterior pituitary. (B) Double label immunohistochemistry, showing a decreased TSHβ expression in αGSU/Tbx19-expressing cells of the Pit-1 lineage, but with no coexpression of POMC and TSHβ. (C) A Tbx19 mutant incapable of specific binding to cognate DNA elements no longer induced rostral tip expression of POMC or decreased αGSU gene expression in ventral pituitary.

