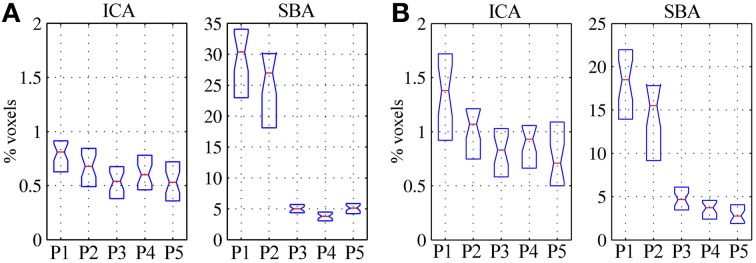
Figure 4.

Volume of significant activations (z = 2) outside the regions-of-interest covering the expected DMN nodes (i.e., PCC, LPR, LPL, and MPFC), for the DMN maps extracted through ICA (left) and SBA (right), expressed as percent with respect to the parenchymal volume for (A) healthy controls and (B) patients. As preprocessing steps were added to the pipeline (P1–P5), the extent of activations outside the expected localization of the DMN was progressively reduced, representing greater specificity of the functional connectivity maps; the effect was considerably more marked for SBA than ICA.
