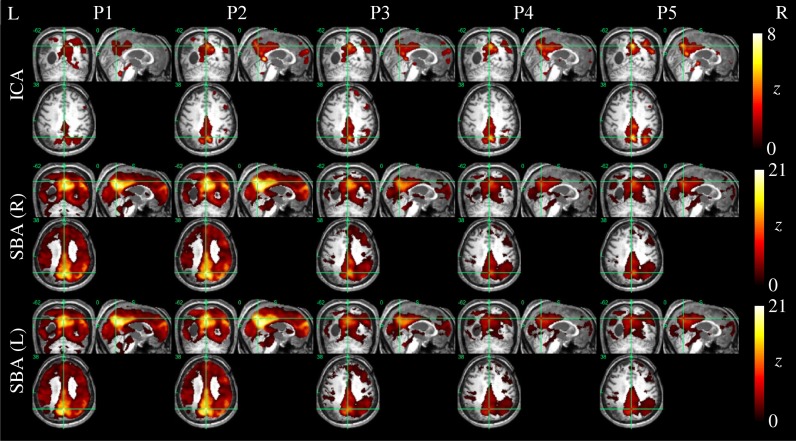
Figure 6.
DMN functional connectivity maps computed with ICA (top row) and SBA (middle and bottom rows) for a patient with a clinical diagnosis of vegetative state (maximum displacement 4.0 mm, 27/200 outlier volumes). As preprocessing steps were added (left to right, P1–P5), activity in the right angular gyrus became more evident on the ICA maps. For SBA, enhanced preprocessing had the effect of progressively reducing the diffuse correlations observed throughout the brain, revealing a topographical pattern that converged to that extracted by ICA.

