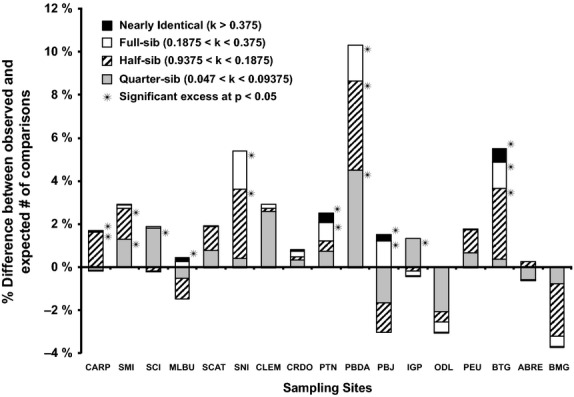
Fig. 4.

Histogram of the proportion of kinship observed for each site that is in excess of expected levels due to chance in four kinship categories: ‘quarter-sib’, 0.047 < k < 0.09375; ‘half-sib’, 0.09375 < k < 0.1875; ‘full-sib’, 0.1875 < k < 0.375; and ‘nearly identical’, 0.375 < k < 0.57. Asterisks indicate significant (P < 0.05) differences between the observed and expected proportion of kinship comparisons within that category at that site. Expected kinship levels were constructed using 10 000 permutations of all kinship values across all sites without replacement to generate the distribution of kinship values that should occur if individuals were randomly distributed among sites. The nearly identical bin represents comparisons above full-sibs and is based on our kinship coefficient distribution for comparisons of individuals to themselves. Counts of the actual number of pairwise comparisons at each site that fell within each kinship category are listed in Table S3.
