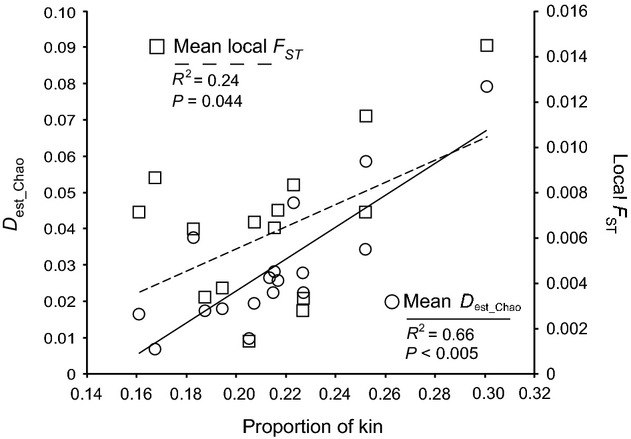
Fig. 5.

Linear regression of mean pairwise Dest_Chao (circles, solid line) and local FST (squares, dashed line) for seven microsatellite loci. Both metrics were regressed on the proportion of within-site kinship comparisons at each site that are significantly (P < 0.05) greater than k = 0.047 (the lower boundary of the four designated kinship categories).
