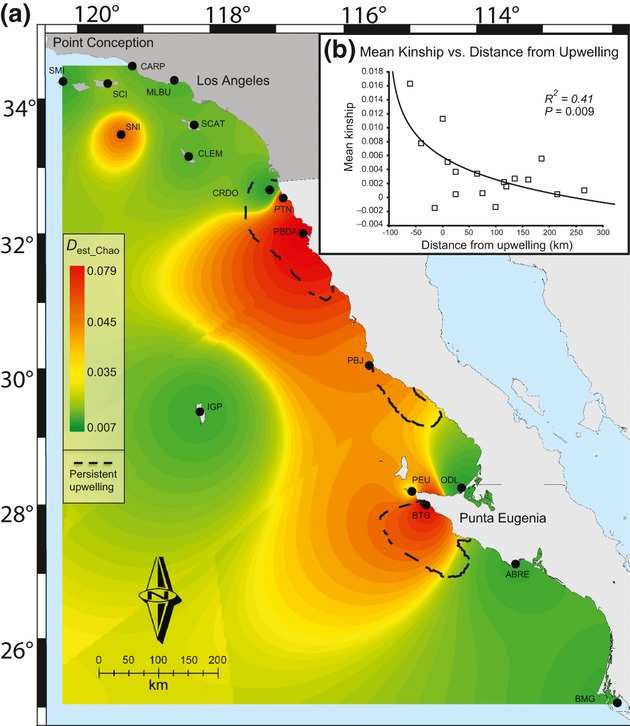
Fig. 6.

(a) Map of lobster specimen collection locations overlaid with an inverse weighted distance interpolation of mean Dest_Chao values at each site created using the Spatial Analyst extension in arcgis 10. Red coloration represents areas of greatest genetic differentiation, green represents areas of little genetic differentiation, and yellow and orange represent the graded values between these extremes. Mean kinship values at each site showed the same pattern as Dest_Chao, with the highest kinship in red and lowest in green. Dashed lines circle areas of consistently high upwelling intensity (adapted from Zaytsev et al. 2003). There are also areas of high upwelling intensity at Point Conception, and one south of Bahia Magdalena that are not captured by this map. (b) Log-linear regression of mean kinship at each site on the distance (km) to the nearest edge of an area of high upwelling intensity [from (a)].
