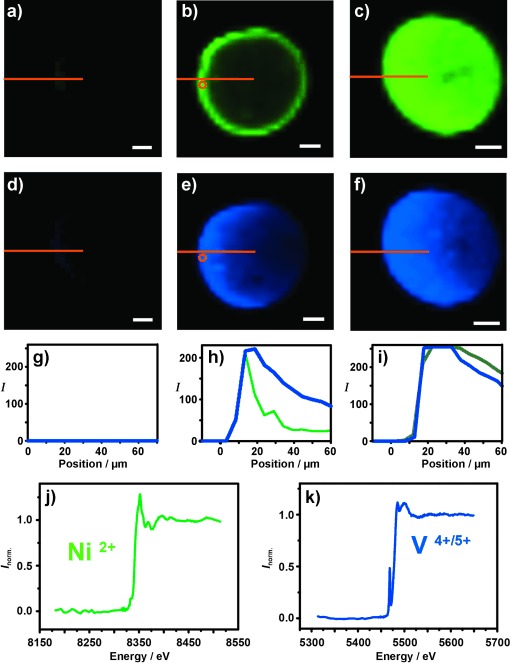
Figure 2.

μ-XRF 2D chemical maps of Ni (a–c) and V (d–f) for a fresh (a,d), Ecat (b,e), and Mitchell (c,f) FCC catalyst particle. The orange lines illustrate the position where the intensity profiles were taken. Scale bars: 20 μm. g–i) 1D X-ray fluorescence intensity profiles as a function of the position inside the FCC catalyst particle derived from the 2D images for a g) fresh, h) Ecat, and i) Mitchell FCC catalyst particle. j) Ni and k) V μ-XANES spectra of the spots highlighted with the orange circle for the Ecat particle. The spatial resolution of μ-XRF maps and μ-XANES spectra was 5×5 μm2.
