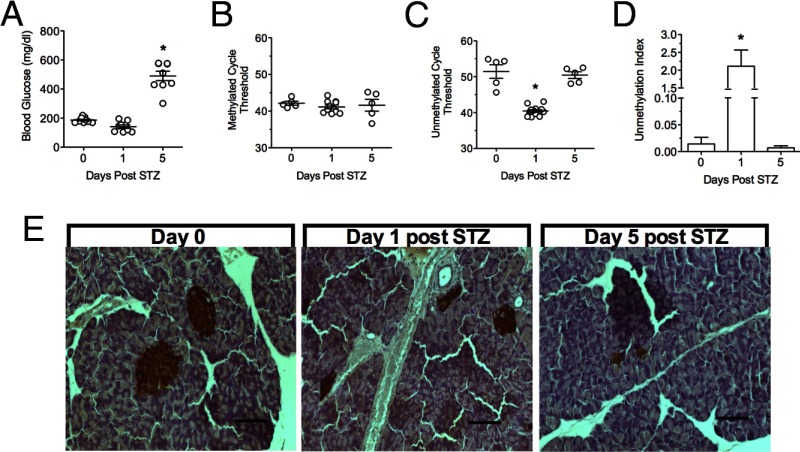
Figure 2.
Blood Glucose and Unmethylation Index Values in Mice Treated with High-Dose STZ. A, Random longitudinal blood glucose values from high-dose STZ-treated BL6 mice. B, Ct values of methylated PPI DNA. C, Ct values of unmethylated PPI DNA. D, Unmethylation index at 0, 1, and 5 days post-STZ injection. E, Insulin (brown) and hematoxylin (blue) staining of pancreas tissue at 0, 1, and 5 days post-STZ injection (scale bar, 100 μm). n = 5, *, P < .05 compared with time 0.

