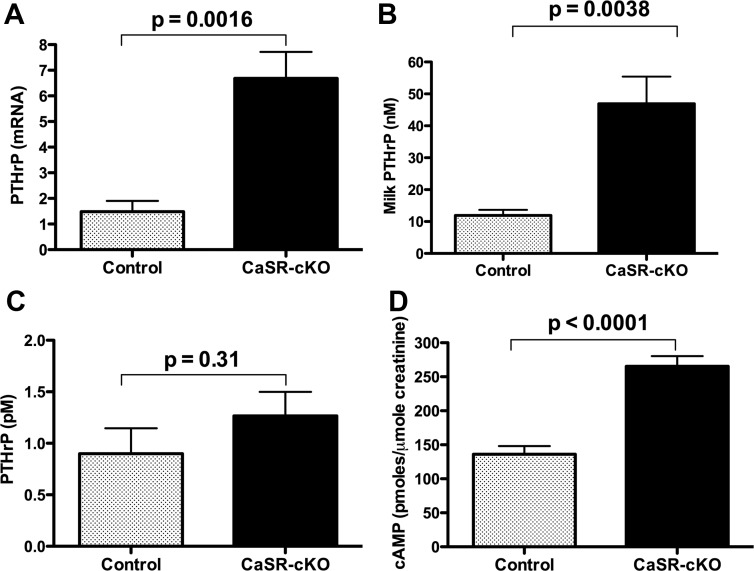
Figure 2.
Loss of the CaSR increases PTHrP production by the mammary gland. A, PTHrP mRNA levels in lactating mammary glands as measured by quantitative PCR. Bars represent the mean ± SEM for 6 mice of each genotype. B, Immunoreactive PTHrP levels measured in milk harvested from control and CaSR-cKO dams. Bars represent the mean ± SEM for 5 mice of each genotype. C, Circulating plasma immunoreactive PTHrP levels in control and CaSR-cKO mice on day 12 of lactation. Bars represent the mean ± SEM for 6 mice of each genotype. D, Urinary cAMP concentrations corrected for creatinine excretion in control and CaSR-cKO mice on day 12 of lactation. Bars represent the mean ± SEM for 13 mice of each genotype.

