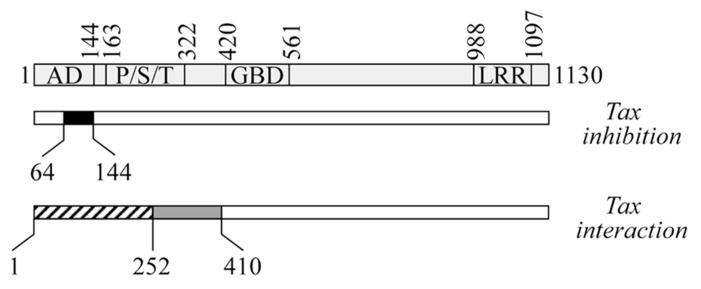
FIGURE 2.
Schematic representation of CIITA regions involved in the suppression ofTax function and in CIITA-Tax association. At the top is a diagram of CIITA with its domains: AD, activation domain; P/S/T, proline/serine/threonine-rich domain; GBD, GTP-binding domain; and LRR, leucine-rich repeats. The black box represents the minimal domain from positions 64–144 that is necessary to block the transcription function of Tax (Tax-inhibition, middle). Hatched (positions 1–252) and gray (positions 253–410) boxes represent the two regions of CIITA interacting with Tax (Tax interaction, bottom).

