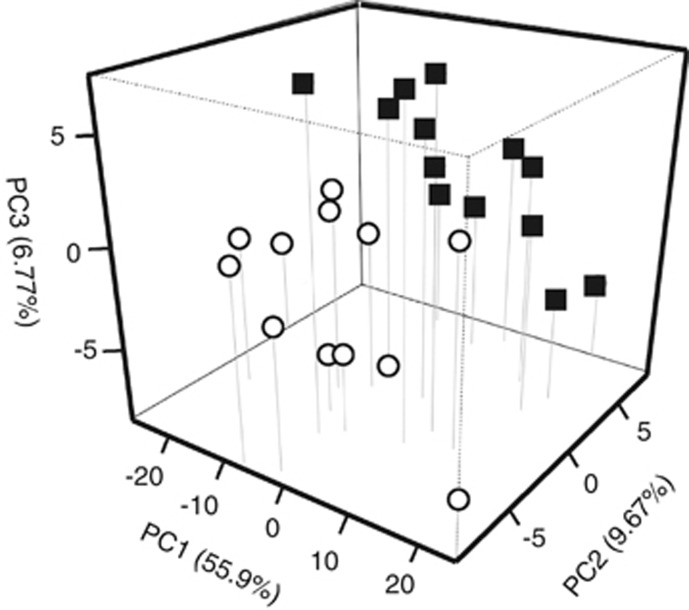
Figure 3.
Principal component analysis of the proteome results for TAV2 cells grown under 2% or 20% O2. Components were: (1) O2 concentration, (2) biological replicate and (3) technical replicate. Open circles represent samples of cells grown under 2% O2, whereas closed squares represent cells under 20% O2.

