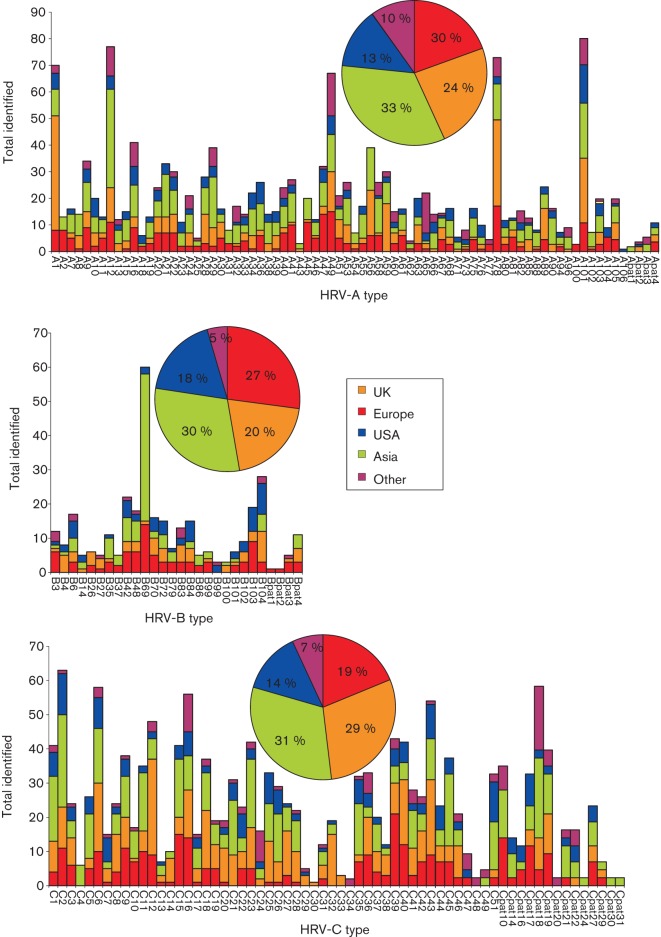
Fig. 7.
Detection frequencies of different HRV species and types reported from different geographical locations. Total numbers of sequences from each geographical area are shown in the inset pie chart. This analysis excluded HRV types for which geographical information was limited or unavailable (HRV-A50, -A57, -A64, -B5, -B17, -B91 and -C50).

