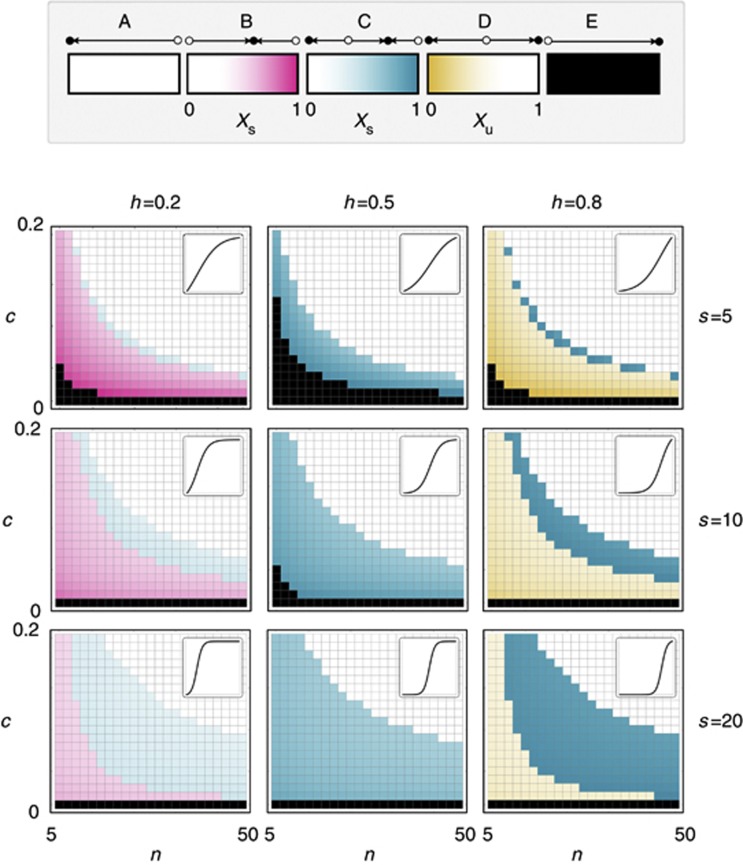
Figure 2.
Types of evolutionary dynamics as a function of the parameters. Each plot is drawn for different values of s (the steepness of the benefit function) and h (the threshold of the benefit function), that is, for different types of benefit of the growth factor (a function of the fraction of producers, represented by the small panels on the top right; see Figure 1), and shows the type of dynamics as a function of c (the cost of producing the growth factor) and n (group size). There are five types of dynamics (see Figure 1). (A) Only x=0 is stable. (B) Only x=xs is stable. (C) Both x=0 and x=xs are stable. (D) Both x=0 and x=1 are stable. (E) Only x=1 is stable. Colours show the values of the stable (xs) or unstable (xu) equilibria.

