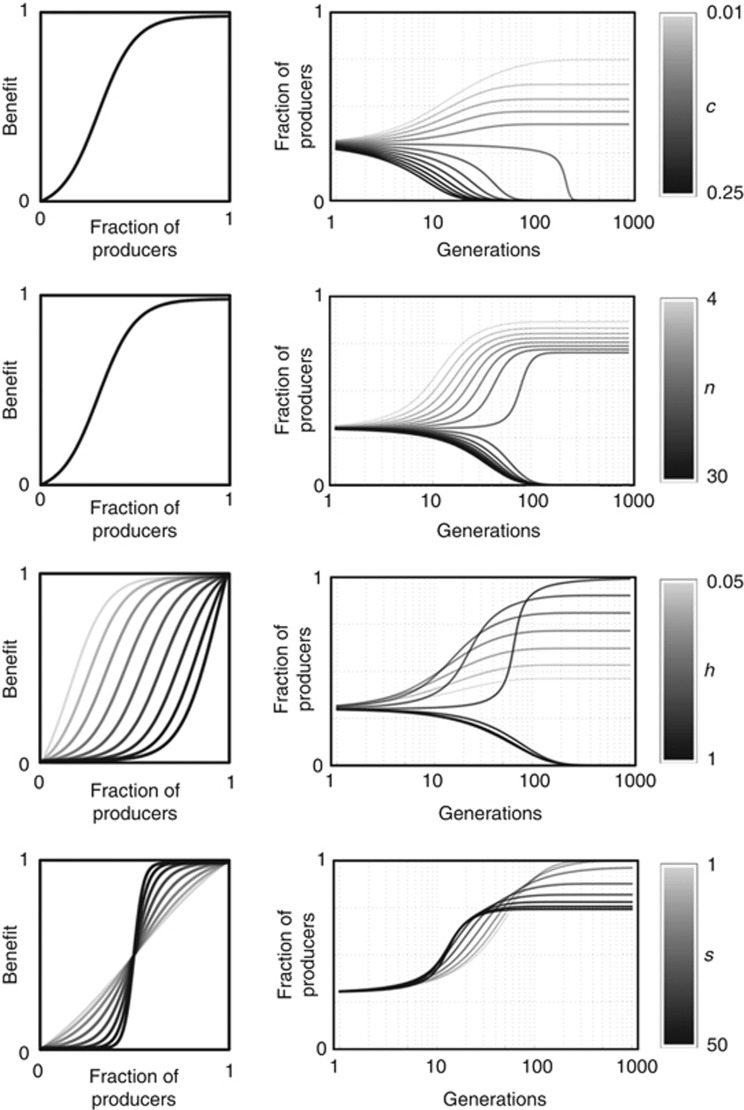
Figure 3.
Effect of the parameters on the equilibrium fraction of producers. The fraction of producers is plotted over time for different values of c (the cost of production), n (the number of cells within the diffusion range of the growth factor), h (the inflection of the benefit function) and s (the steepness of the benefit function), starting from the same initial frequencies.

