
Figure 10.
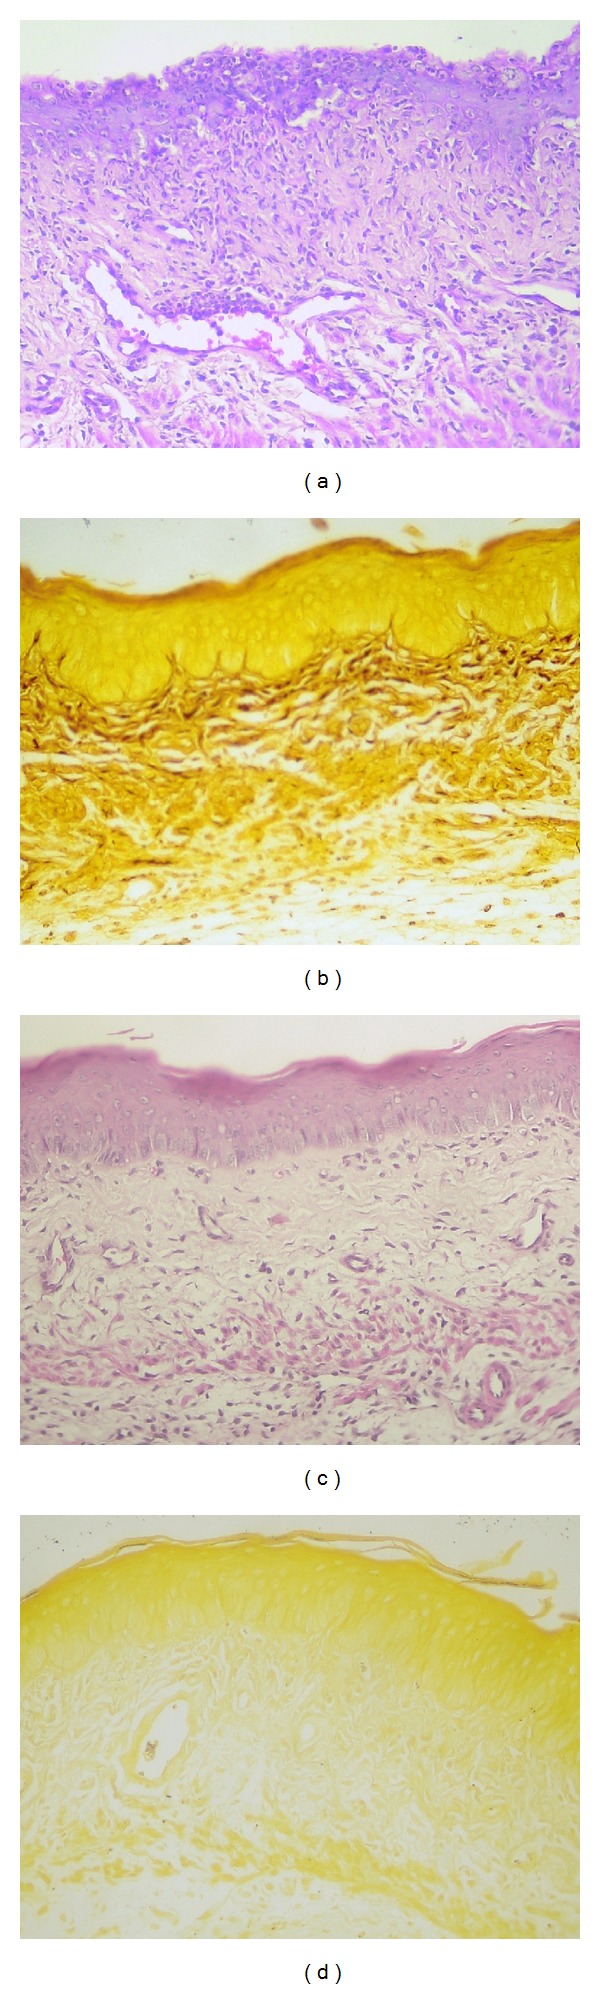
Histological slices of vaginal mucosa with 10 days of infection, showing ((a)-(b)) negative control group and ((c)-(d)) clotrimazole cream treatment (10 days of treatment). Tissular inflammation can be seen in “a” and “c,” with the presence of neutrophils influx (H&E coloration). GMS coloration (b and d) shows C. albicans presence in Control group (b), showing the efficacy of the model implementation and absence of C. albicans in clotrimazole at this time (d). (×40 magnification).