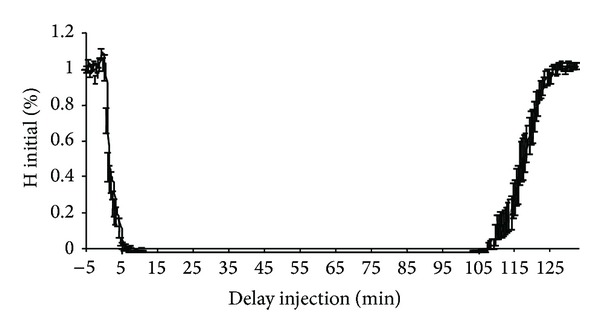
Figure 4.

Mean time course of the amplitude of the H response expressed in relation to the baseline H response before and after application of lidocaine. Time (minutes) after application of lidocaine (performed at time 0) is shown on the x-axis. The mean amplitude of the H response of the 18 rats expressed in relation to the baseline H response (corresponding to the mean of 10 H responses studied before application of lidocaine) is shown on the y-axis. The interval shown on the curve corresponds to the standard error.
