
Fig. 2.
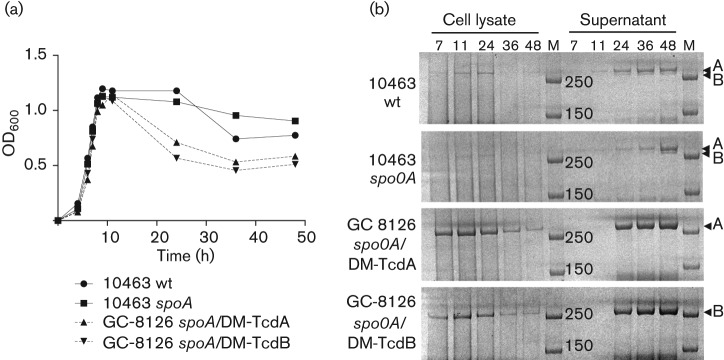
TcdA and TcdB expression in wt and recombinant toxin production strains. (a) Bacterial growth curves of strains expressing native toxins (VPI 10463, solid lines) and recombinant double mutant (DM) antigens (GC-8126, dotted lines). (b) TcdA and TcdB expression in cell pellets and in culture supernatants at 7, 11, 24, 36 and 48 h time points. Crude cell lysates and culture supernatants were separated by SDS-PAGE and high molecular mass toxins/toxoids visualized with Coomasie stain. Samples were concentrated 10-fold by membrane filtration before loading the gel. Arrowheads indicate location of full-length TcdA and TcdB proteins. M, molecular mass markers (250 and 150 kDa).