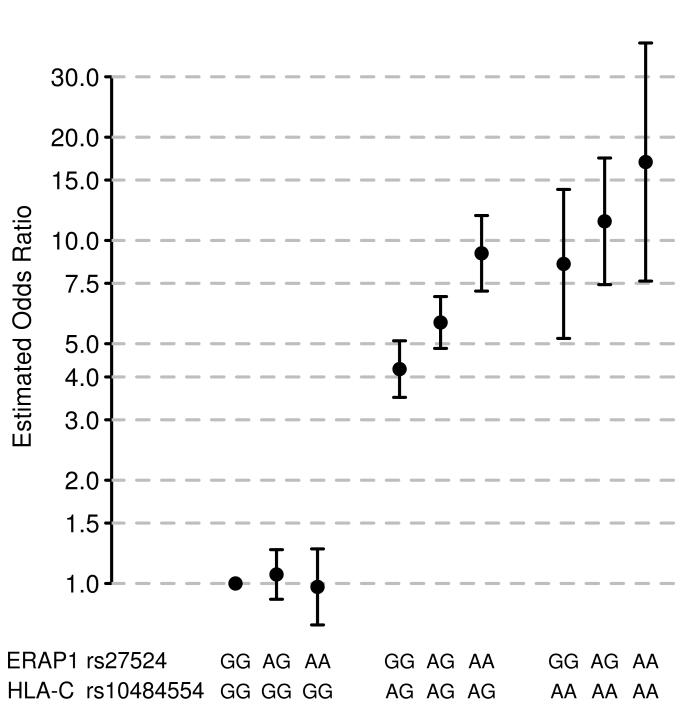
Figure 3.
Statistical interaction between ERAP1 and HLA-C genotypes.
Odds ratio estimates for ERAP1 genotypes at rs27524 stratified by HLA-C genotypes at rs10484554. Odds ratios were estimated by fitting a logistic regression model which included the first principal component as a covariate and a parameter for each of the possible two-locus genotypes. Note that odds are measured relative to the most protective two-locus genotype (which by definition has an odds ratio of 1). Bars represent 95% confidence intervals calculated from the standard error of the estimates of the genotype parameters in logistic regression model.

