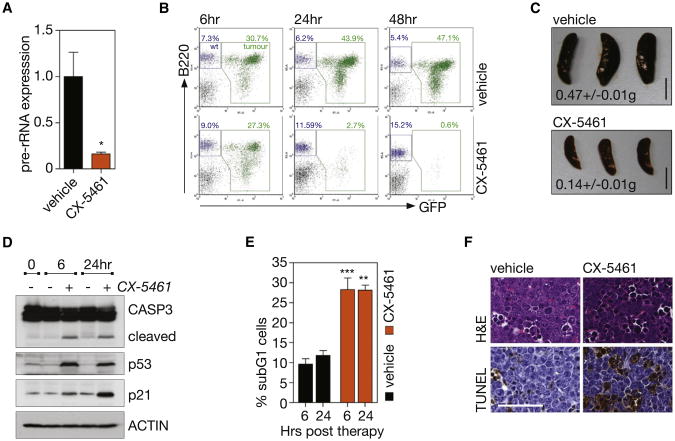
Figure 5. Therapeutic Administration of CX-5461 Selectively Kills Transplanted p53 Wild-type Eμ-MycLymphoma Cells In Vivo.
(A) Pre-rRNA expression in tumor bearing lymph nodes of mice transplanted with p53 wild-type Eμ-Myc lymphoma cells (clone 4242) 1 hr posttreatment with 50 mg/kg CX-5461, determined by qRT-PCR (p < 0.05; n = 4). See also Figures S5A and S5B.
(B) FACS analysis of tumor burden in lymph node; stained with antibody against pan B cell marker B220, tumor cells GFP+ (green) (representative of n = 3). See also Figure S5C.
(C) Mean spleen weight ± SEM at 24 hr post therapy (p < 0.001; n = 3). Scale bar represents 1 cm.
(D) Western blot analysis at 6 and 24 hr of cleavage of CASP3, total p53, and p21 in the lymph node.
(E) Quantitation of apoptotic cells in lymph node, determined by subG1 DNA content analysis (vehicle versus CX-5461, p < 0.001 at 6 hr, p < 0.01 at 24 hr; n = 3). See also Figure S5D.
(F) Hematoxylin and eosin (H&E) and TUNEL stained lymph node sections at 6 hr post therapy; images taken at 40× magnification. Scale bar represents 50 μm. Student's two-tailed t test (a). One-way ANOVA with Tukey's multiple comparison posttest (c,e). Error bars represent SEM.

