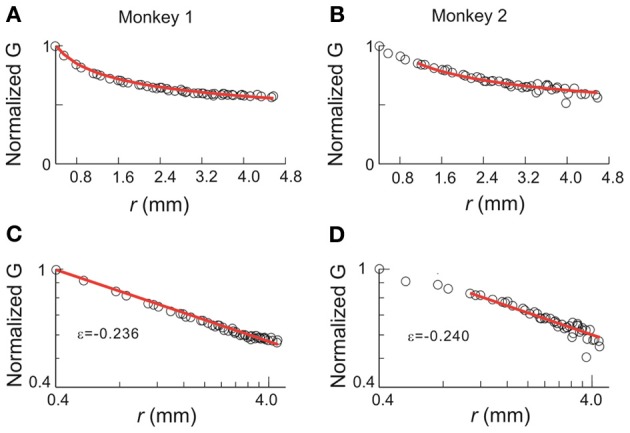
Figure 10.

Correlation function for avalanche activities. Pair-wise covariance, G, of nLFP activities is plotted against the physical distance between the corresponding recording sites. (A,B) Linear coordinates. (C,D) Double-logarithmic coordinates. G is normalized by the value of the G(0.4), i.e., the covariance with the nearest neighbor. In all panels, the data are represented by circles and red lines indicate the best power law fit. The range of power-law fitting is either all possible distances (monkey 1) or r > 1 mm (monkey 2). ε, the exponent of the best fitting power law.
