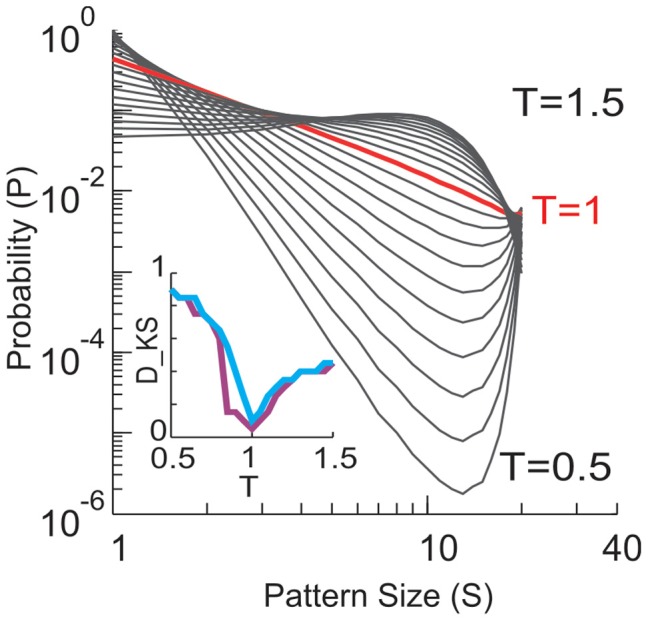
Figure 13.

Size distributions of avalanche patterns computed for one 20-electrode sub-group (taken from data set in Figure 1D) for different T and plotted in double logarithmic coordinates. T changes from 0.5 to 1.5 with a step of 0.05. Distribution at T = 1 is marked by red. Inset: Kolmogorov–Smirnov distance (DKS, a goodness-of-fit measure) between the actual pattern size distributions and best fitting power law (purple) or power law with slope −1.5 (blue) is minimized for T ≈ 1.
