
Figure 5.
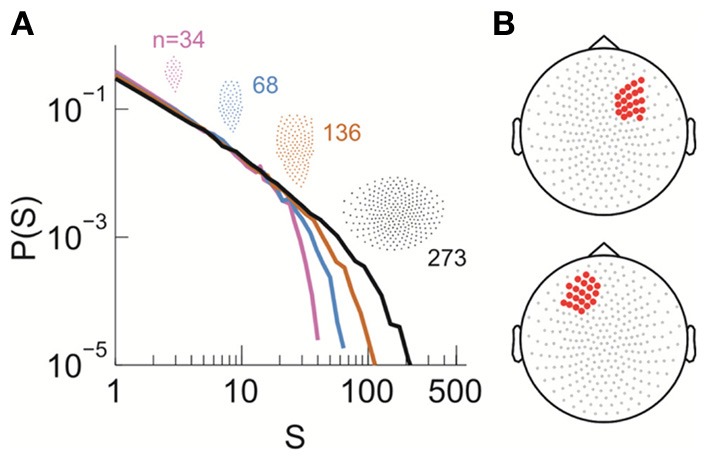
Power law size distribution of neuronal avalanches recorded with MEG for the human brain at resting state. (A) Neuronal avalanche dynamics are identified when the sizes (s) of all clusters distribute according to a power law with slope close of −1.5 (the results for subject 2 are shown here). Four distributions from the same original data set using different areas (insets), i.e., number of MEG sensors (n), are superimposed. (B) The whole array of sensors (gray dots) and two sub-groups of sensors that were used for finite-scaling analysis (red dots) are illustrated. Top, sub-group (A); bottom, sub-group (B). The sub-groups were identical across all three subjects.