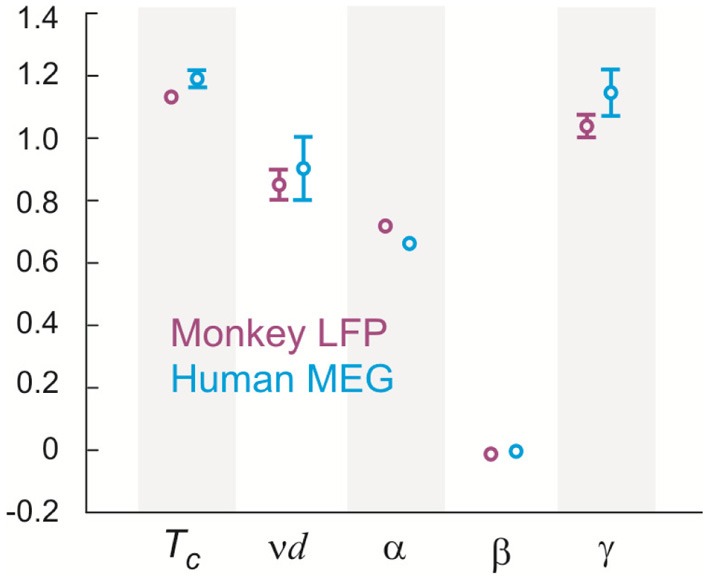
Figure 7.

Tc and critical exponents α, β, γ, and ν estimated using finite size scaling analysis in two monkeys and three human subjects. Four (two) different 20-electrode/sensor sub-groups were analyzed for each monkey (human) dataset resulting in the sample size of 8 (6). Values are mean (center circle) ± s.d. (error bars omitted for s.d. smaller than center circle).
