
Figure 8.
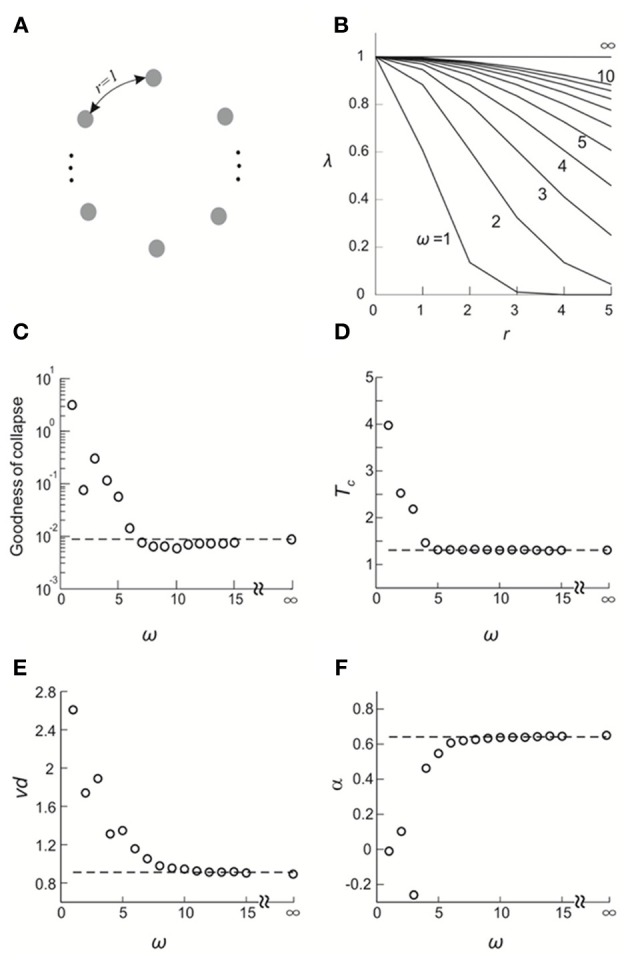
Validating the FSS method by a simple model. (A) All elements are configured in a ring and the distance between any adjacent elements is 1. (B) the covariance of the hidden variables in the DG model, λ, is plotted as a function of the distance, r, that separates corresponding elements for different choices of the standard deviation of a Gaussian function, ω. (C–F) Goodness of collapse, Tc and critical exponents measured for various systems are plotted against ω (open circles). In all systems, λmax and mean event rate were set such that when ω = ∞, the average covariance and the event rate match what we empirically observed for Monkey 1. Corresponding results obtained from actual data for Monkey 1 (averaged across four sub-groups) are shown for comparison (broken lines).