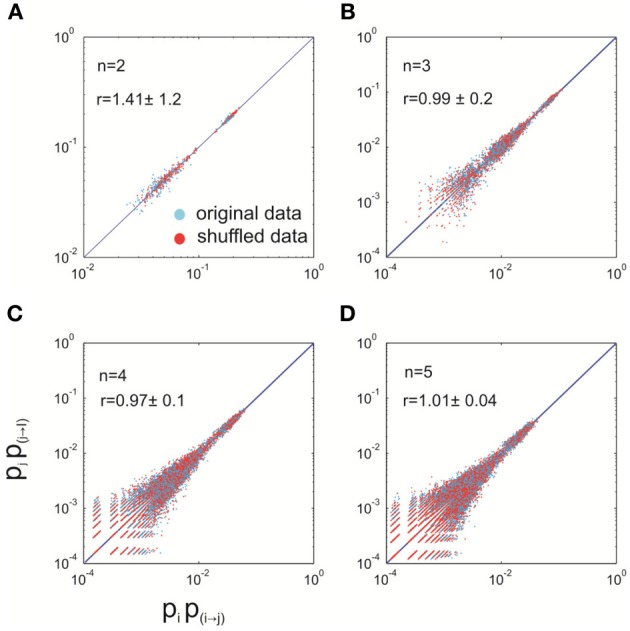
Figure A1.

Detailed balance approximately holds for the data with quiescent periods removed. For differently sized systems (n = 2–5), empirically measured pipi→j is plotted against pjpj→i for both the original data (blue) and shuffled data (red). For every size, 100 different systems (i.e., different combinations of electrodes) were analyzed. The solid lines represent equality. r is a measure of the distance from the equality, relative to that of the shuffled data (see Appendix text A for details). It is represented as mean ±s.d. (across 100 systems). (A–D), system size equals 2, 3, 4, and 5, respectively.
