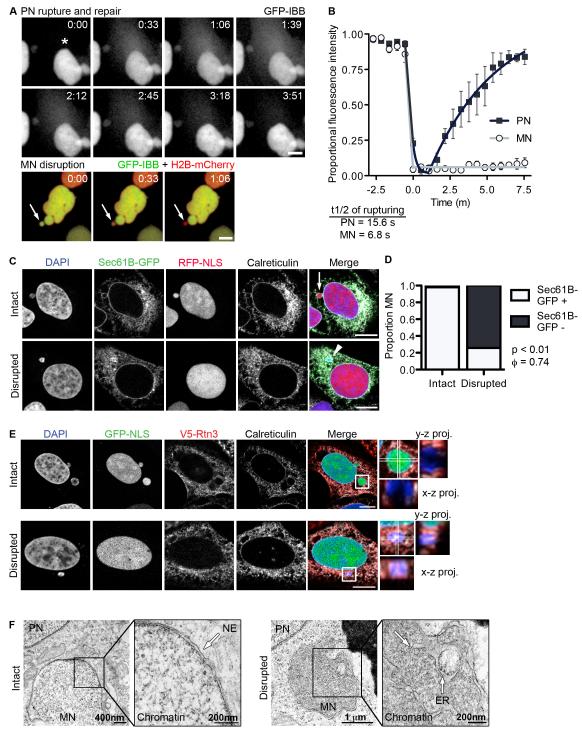
Figure 2. MN disruption occurs by NE collapse and is characterized by ER tubule invasion of the chromatin.
(A) Stills from time-lapse imaging of U2OS GFP-IBB, H2B-mCherry cells undergoing PN rupturing and repair (top) and MN disruption (bottom). An asterisk indicates the site of PN NE rupturing (top) and an arrow indicates the MN (bottom). Time is m:s. All scale bars in figure = 10 μm. (B) Analysis of GFP-IBB fractional fluorescence intensity in nucleus during PN NE rupturing and MN disruption. The rupturing half-time, mean, and s.e.m are shown on graph. N = 5. (C) Images of intact and disrupted MN in U2OS RFP-NLS cells expressing Sec61B-GFP and labeled for the luminal ER protein calreticulin. (D) Quantification of Sec61B-GFP presence at the nuclear rim in intact and disrupted MN, as defined by DAPI staining. N = 300 MN/category from 3 experiments. φ = Phi correlation co-efficient. (E) Images of intact and disrupted MN in U2OS GFP-NLS cells expressing V5-tagged reticulon 3 (V5-Rtn3) and labeled for calreticulin. X-z and y-z projections of boxed regions cover 5.48 μm (top) and 5.97 μm (bottom) stacks, respectively. In top (intact MN) projections, GFP-NLS is omitted for clarity. (F) TEM images of intact (left) and disrupted (right) MN in U2OS GFP-NLS cells 8 h and 18 h post-mitotic shake-off, respectively. In the intact MN membranes (arrows) are excluded from the chromatin and in the disrupted MN ER membranes are visible inside the chromatin. See also Figure S2, Movie S2, Movie S3, and Movie S4.

