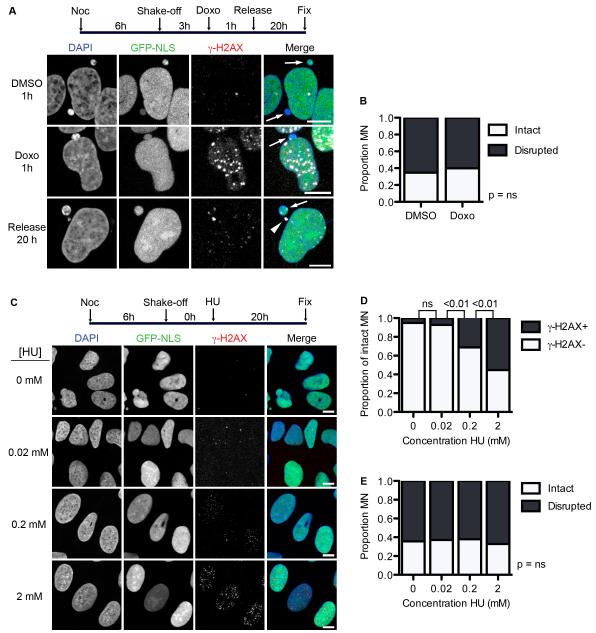
Figure 5. DNA damage does not induce MN disruption.
(A) Experiment schematic and images of U2OS cells labeled with anti-γ-H2AX 20 h after 1 h incubation in DMSO or doxorubicin (doxo). All scale bars = 10 μm. Arrows and arrowheads indicate intact and disrupted MN, respectively. (B) Quantification of MN integrity in cells treated as in (A). P-value > 0.05, determined by Fisher’s exact test. N = 300 MN/condition from 3 experiments. (C) Experiment schematic and images of synchronized cells treated with HU at the indicated concentrations for 20 h, fixed, and labeled with antibodies to γ-H2AX. (D) Quantification of intact MN with multiple γ-H2AX foci 20 h after HU incubation. P-values above graph refer to indicated samples determined by Fisher’s exact test. N = 250 MN/concentration from 3 experiments. (E) Quantification of MN integrity in cells incubated in HU for 20 h. N = 250 MN/concentration from 3 experiments. P-value > 0.05 by χ2 analysis.

