Figure 7.
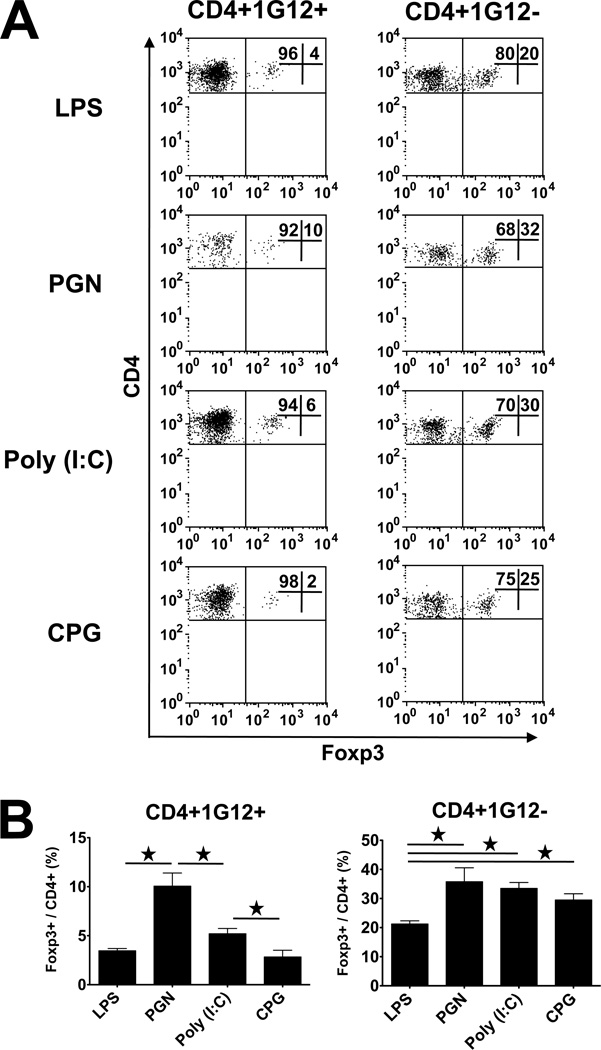
Frequency of Foxp3+ Treg cells among donor and recipient CD4 cells in the eyes of recipient mice. (A) Flow cytometric analysis of CD4 cells collected from eyes of TLR ligand-treated recipient mice, collected on day 3 following adoptive transfer of 5 million naïve 3A9 CD4 cells. An inverted correlation is seen in general between severity of inflammation and level of Foxp3+ cells among both donor and host infiltrating CD4 cells. (B) Calculated mean percentages of Foxp3+ cells among donor and recipient CD4 cells.

